

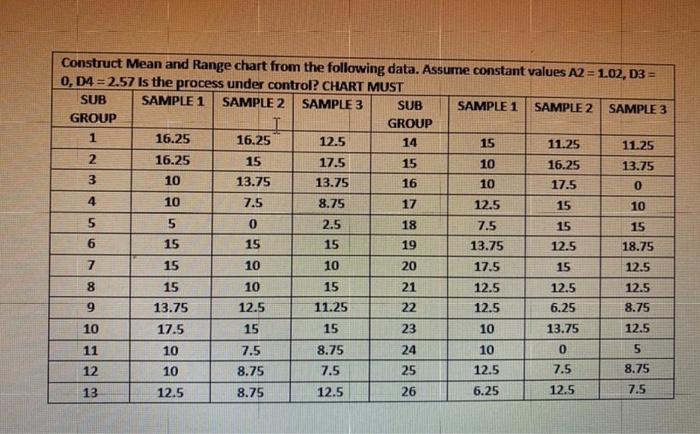
Question: Construct Mean and Range chart from the following data. Assume constant values A2 = 1.02, D3 = 0, D4 = 2.57 Is the process under
Step by Step Solution
There are 3 Steps involved in it
1 Expert Approved Answer
Step: 1 Unlock

Question Has Been Solved by an Expert!
Get step-by-step solutions from verified subject matter experts
Step: 2 Unlock
Step: 3 Unlock