

Question: As a project manager in a construction site, you are in charge of assessing 3 different alternatives with different strategy appraisals as given in Table1.
As a project manager in a construction site, you are in charge of assessing 3 different alternatives with different strategy appraisals as given in Table1. Perform a sensitivity analysis and decide about the most economical alternative using AW analysis and an interest rate equal to x%.
1) Calculate the AW of NCF values for different life estimates.
2) The MARR for the company varies from 5% to 30% per year for different alternatives. Plot and evaluate the sensitivity of AW to the interest rate parameter according to the selected alternative in terms of total PV in the first part. (25 Marks) ( At least 5 different value should be considered)
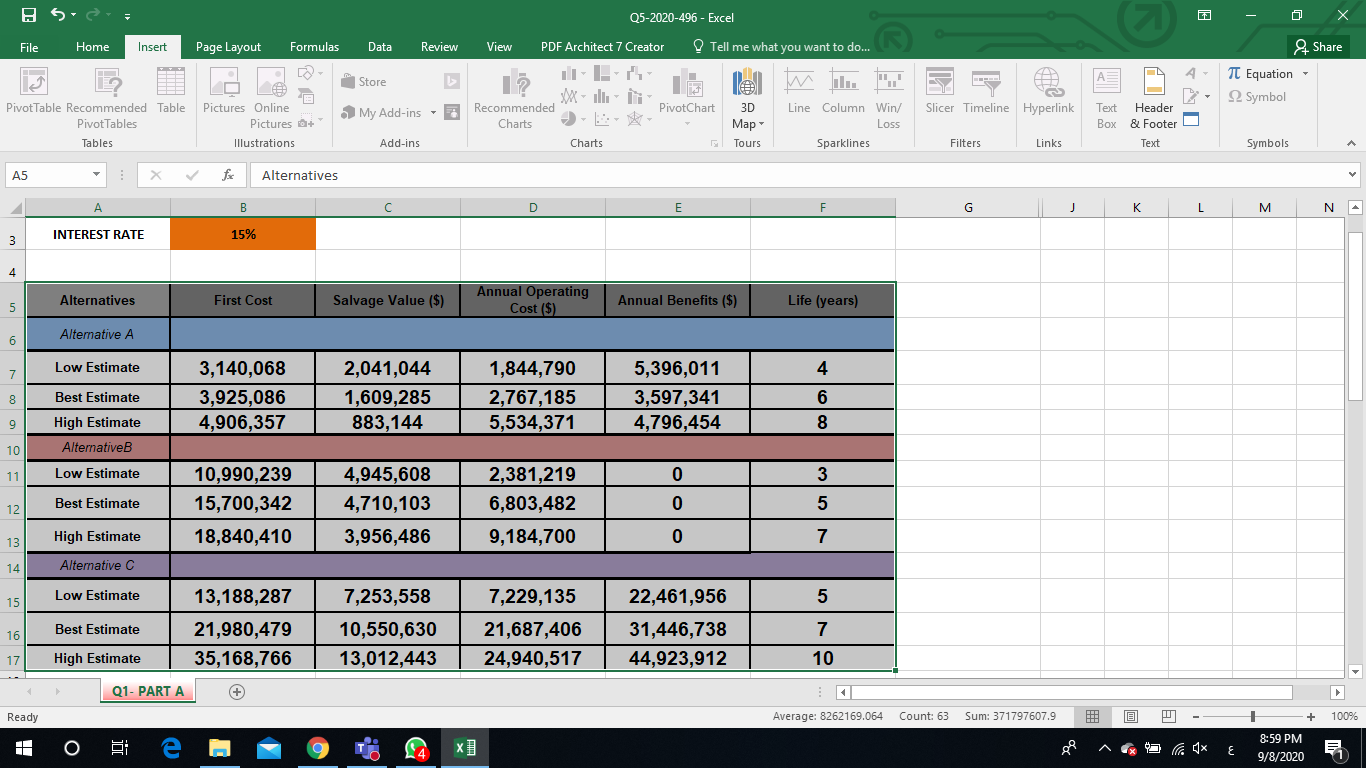
Q5-2020-496 - Excel File Home Insert Page Layout Formulas Data Review View PDF Architect 7 Creator Tell me what you want to do... & Share Store TT Equation 12 Symbol My Add-ins PivotChart XXXIII Recommended Charts Pivot Table Recommended Table Pivot Tables Tables Slicer Timeline Hyperlink Pictures Online Pictures + Illustrations lel 3D Tours Line Column Win/ Loss Sparklines Text Header Box & Footer o Text Add-ins Charts Filters Links Symbols A5 Alternatives B D E G J K L M N 3 15% INTEREST RATE 4 Alternatives First Cost Salvage Value ($) Annual Operating Cost ($) Annual Benefits ($) Life (years) 5 Alternative A 6 Low Estimate 4 7 8 Best Estimate 3,140,068 3,925,086 4,906,357 2,041,044 1,609,285 883,144 1,844,790 2,767,185 5,534,371 5,396,011 3,597,341 4,796,454 6 8 9 10 High Estimate AlternativeB Low Estimate 11 0 3 12 Best Estimate 10,990,239 15,700,342 18,840,410 4,945,608 4,710,103 3,956,486 2,381,219 6,803,482 9,184,700 0 5 13 High Estimate 0 7 14 Alternative Low Estimate 15 5 13,188,287 21,980,479 35,168,766 Best Estimate 7,253,558 10,550,630 13,012,443 7,229,135 21,687,406 24,940,517 22,461,956 31,446,738 44,923,912 16 7 17 High Estimate 10 Q1- PART A + Ready Average: 8262169.064 Count: 63 Sum: 371797607.9 + 100% 4 1x E 8:59 PM 9/8/2020 Q5-2020-496 - Excel File Home Insert Page Layout Formulas Data Review View PDF Architect 7 Creator Tell me what you want to do... & Share Store TT Equation 12 Symbol My Add-ins PivotChart XXXIII Recommended Charts Pivot Table Recommended Table Pivot Tables Tables Slicer Timeline Hyperlink Pictures Online Pictures + Illustrations lel 3D Tours Line Column Win/ Loss Sparklines Text Header Box & Footer o Text Add-ins Charts Filters Links Symbols A5 Alternatives B D E G J K L M N 3 15% INTEREST RATE 4 Alternatives First Cost Salvage Value ($) Annual Operating Cost ($) Annual Benefits ($) Life (years) 5 Alternative A 6 Low Estimate 4 7 8 Best Estimate 3,140,068 3,925,086 4,906,357 2,041,044 1,609,285 883,144 1,844,790 2,767,185 5,534,371 5,396,011 3,597,341 4,796,454 6 8 9 10 High Estimate AlternativeB Low Estimate 11 0 3 12 Best Estimate 10,990,239 15,700,342 18,840,410 4,945,608 4,710,103 3,956,486 2,381,219 6,803,482 9,184,700 0 5 13 High Estimate 0 7 14 Alternative Low Estimate 15 5 13,188,287 21,980,479 35,168,766 Best Estimate 7,253,558 10,550,630 13,012,443 7,229,135 21,687,406 24,940,517 22,461,956 31,446,738 44,923,912 16 7 17 High Estimate 10 Q1- PART A + Ready Average: 8262169.064 Count: 63 Sum: 371797607.9 + 100% 4 1x E 8:59 PM 9/8/2020
Step by Step Solution
There are 3 Steps involved in it

Get step-by-step solutions from verified subject matter experts