

As a talent development executive at a commercial bank, Jillian Herbet was tasked with training first-year...
Fantastic news! We've Found the answer you've been seeking!
Question:
Transcribed Image Text:
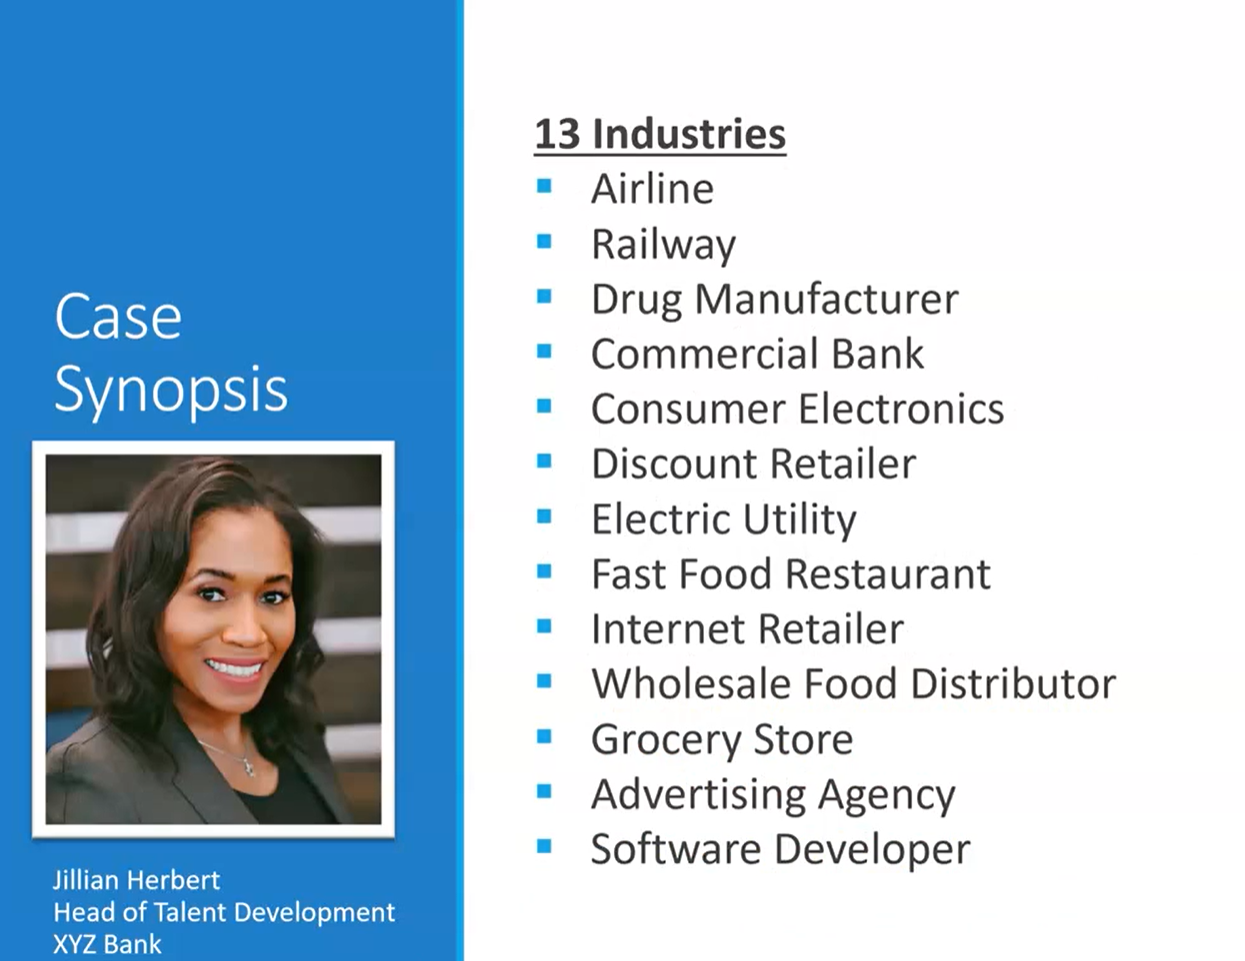
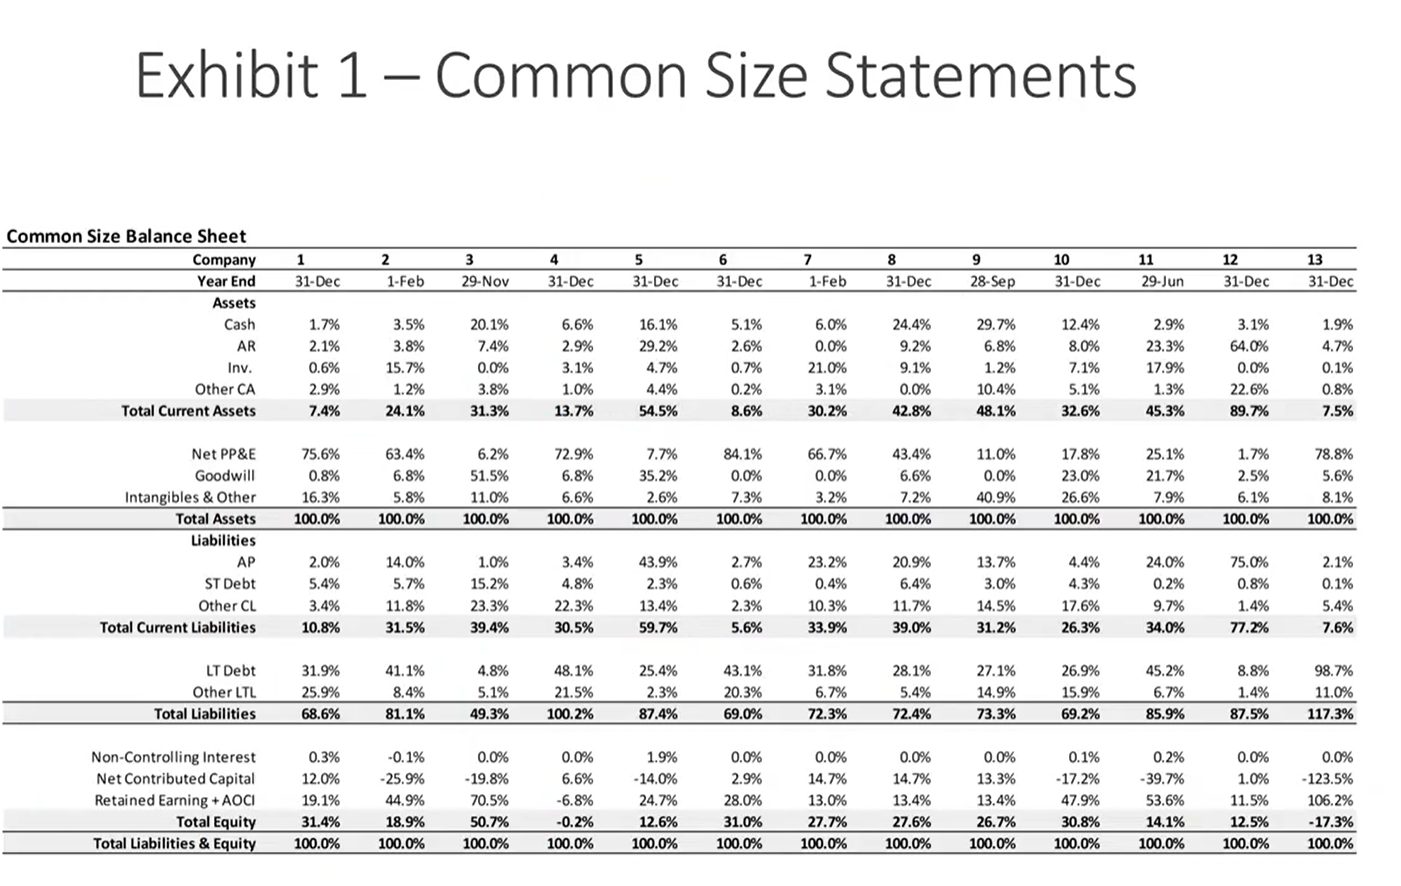
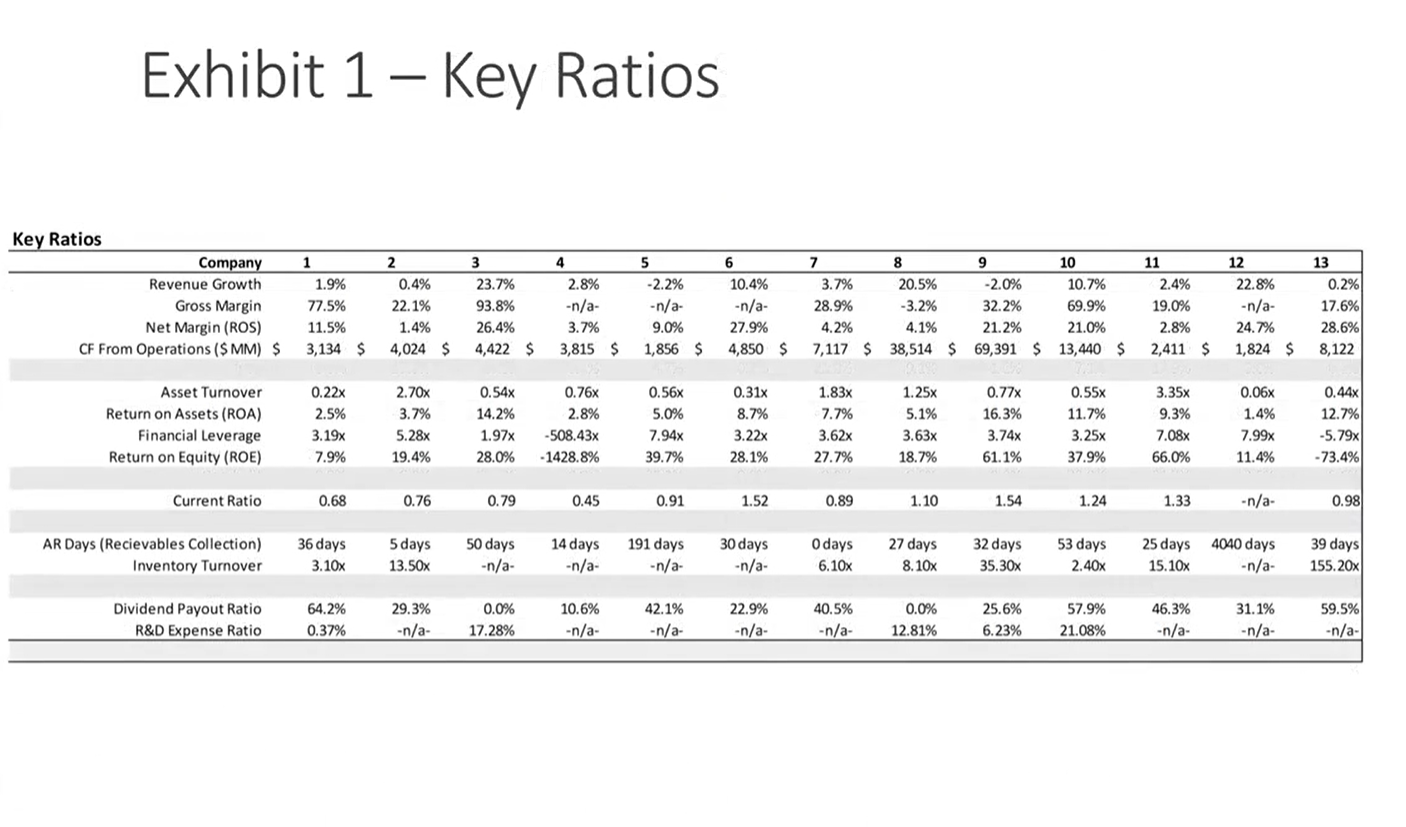
As a talent development executive at a commercial bank, Jillian Herbet was tasked with training first-year analysts. With each new class, Jillian worked to develop financial intuition and to inspire young analysts to embrace financial analysis as a process of crafting and deciphering a financial story. At the end of the first session on introductory financial statement analysis, Jillian would pose a challenge. After providing the analysts with a set of financial data for 13 firms for fiscal year 2019, she challenged the analysts to use their intuition to match each column in the exhibit with one of the industries. Case Synopsis Jillian Herbert Head of Talent Development XYZ Bank 13 Industries Airline Railway Drug Manufacturer Commercial Bank Consumer Electronics Discount Retailer Electric Utility Fast Food Restaurant Internet Retailer Wholesale Food Distributor Grocery Store Advertising Agency Software Developer Exhibit 1-Common Size Statements Common Size Balance Sheet Company Year End 1 2 3 4 5 6 7 8 9 10 11 12 13 31-Dec 1-Feb 29-Nov 31-Dec 31-Dec 31-Dec 1-Feb 31-Dec 28-Sep 31-Dec 29-Jun 31-Dec 31-Dec Assets Cash 1.7% 3.5% 20.1% 6.6% 16.1% 5.1% 6.0% 24.4% 29.7% 12.4% 2.9% 3.1% 1.9% AR 2.1% 3.8% 7.4% 2.9% 29.2% 2.6% 0.0% 9.2% 6.8% 8.0% 23.3% 64.0% 4.7% Inv. 0.6% 15.7% 0.0% 3.1% 4.7% 0.7% 21.0% 9.1% 1.2% 7.1% 17.9% 0.0% 0.1% Other CA 2.9% 1.2% 3.8% 1.0% 4.4% 0.2% 3.1% 0.0% 10.4% 5.1% 1.3% 22.6% 0.8% Total Current Assets 7.4% 24.1% 31.3% 13.7% 54.5% 8.6% 30.2% 42.8% 48.1% 32.6% 45.3% 89.7% 7.5% Net PP&E 75.6% 63.4% 6.2% 72.9% 7.7% 84.1% 66.7% 43.4% 11.0% 17.8% 25.1% 1.7% 78.8% Goodwill 0.8% 6.8% 51.5% 6.8% 35.2% 0.0% 0.0% 6.6% 0.0% 23.0% 21.7% 2.5% 5.6% Intangibles & Other 16.3% 5.8% 11.0% 6.6% 2.6% 7.3% 3.2% 7.2% 40.9% 26.6% 7.9% 6.1% 8.1% Total Assets 100.0% 100.0% 100.0% 100.0% 100.0% 100.0% 100.0% 100.0% 100.0% 100.0% 100.0% 100.0% 100.0% Liabilities AP 2.0% 14.0% 1.0% 3.4% 43.9% 2.7% 23.2% 20.9% 13.7% 4.4% 24.0% 75.0% 2.1% ST Debt 5.4% 5.7% 15.2% 4.8% 2.3% 0.6% 0.4% 6.4% 3.0% 4.3% 0.2% 0.8% 0.1% Other CL 3.4% 11.8% 23.3% 22.3% 13.4% 2.3% 10.3% 11.7% 14.5% 17.6% 9.7% 1.4% 5.4% Total Current Liabilities 10.8% 31.5% 39.4% 30.5% 59.7% 5.6% 33.9% 39.0% 31.2% 26.3% 34.0% 77.2% 7.6% LT Debt 31.9% 41.1% 4.8% 48.1% 25.4% 43.1% 31.8% 28.1% 27.1% 26.9% 45.2% 8.8% 98.7% Other LTL 25.9% 8.4% 5.1% 21.5% 2.3% 20.3% 6.7% 5.4% 14.9% 15.9% 6.7% 1.4% 11.0% Total Liabilities 68.6% 81.1% 49.3% 100.2% 87.4% 69.0% 72.3% 72.4% 73.3% 69.2% 85.9% 87.5% 117.3% Non-Controlling Interest 0.3% -0.1% 0.0% 0.0% 1.9% 0.0% 0.0% 0.0% 0.0% 0.1% 0.2% 0.0% 0.0% Net Contributed Capital Retained Earning + AOCI 12.0% -25.9% -19.8% 6.6% -14.0% 2.9% 14.7% 14.7% 13.3% -17.2% -39.7% 1.0% -123.5% 19.1% 44.9% 70.5% -6.8% 24.7% 28.0% 13.0% 13.4% 13.4% 47.9% 53.6% 11.5% 106.2% Total Equity 31.4% 18.9% 50.7% -0.2% 12.6% 31.0% 27.7% 27.6% 26.7% 30.8% 14.1% 12.5% -17.3% Total Liabilities & Equity 100.0% 100.0% 100.0% 100.0% 100.0% 100.0% 100.0% 100.0% 100.0% 100.0% 100.0% 100.0% 100.0% Key Ratios Exhibit 1-Key Ratios Company Revenue Growth Gross Margin Net Margin (ROS) 1 2 3 4 5 6 7 8 9 10 11 12 13 1.9% 0.4% 23.7% 2.8% -2.2% 10.4% 3.7% 20.5% -2.0% 10.7% 2.4% 22.8% 0.2% 77.5% 22.1% 93.8% -n/a- -n/a- -n/a- 28.9% -3.2% 32.2% 69.9% 19.0% -n/a- 17.6% 11.5% 1.4% 26.4% 3.7% 9.0% 27.9% 4.2% 4.1% 21.2% 21.0% 2.8% 24.7% 28.6% CF From Operations ($ MM) $ 3,134 $ 4,024 $ 4,422 $ 3,815 $ 1,856 $ 4,850 $ 7,117 $ 38,514 $ 69,391 $ 13,440 $ 2,411 $ 1,824 $ 8,122 Asset Turnover 0.22x 2.70x 0.54x 0.76x 0.56x 0.31x 1.83x 1.25x 0.77x 0.55x 3.35x 0.06x 0.44x Return on Assets (ROA) 2.5% 3.7% 14.2% 2.8% 5.0% 8.7% 7.7% 5.1% 16.3% 11.7% 9.3% 1.4% 12.7% Financial Leverage 3.19x 5.28x 1.97x -508.43x 7.94x 3.22x 3.62x 3.63x 3.74x 3.25x 7.08x 7.99x -5.79x Return on Equity (ROE) 7.9% 19.4% 28.0% -1428.8% 39.7% 28.1% 27.7% 18.7% 61.1% 37.9% 66.0% 11.4% -73.4% Current Ratio 0.68 0.76 0.79 0.45 0.91 1.52 0.89 1.10 1.54 1.24 1.33 -n/a- 0.98 AR Days (Recievables Collection) 36 days 5 days Inventory Turnover 3.10x 13.50x 50 days -n/a- 14 days -n/a- 191 days -n/a- 30 days -n/a- Odays 6.10x 27 days 8.10x 32 days 53 days 25 days 4040 days 39 days 35.30x 2.40x 15.10x -n/a- 155.20x Dividend Payout Ratio 64.2% 29.3% 0.0% 10.6% 42.1% 22.9% 40.5% 0.0% 25.6% 57.9% 46.3% 31.1% 59.5% R&D Expense Ratio 0.37% -n/a- 17.28% -n/a- -n/a- -n/a- -n/a- 12.81% 6.23% 21.08% -n/a- -n/a- -n/a- As a talent development executive at a commercial bank, Jillian Herbet was tasked with training first-year analysts. With each new class, Jillian worked to develop financial intuition and to inspire young analysts to embrace financial analysis as a process of crafting and deciphering a financial story. At the end of the first session on introductory financial statement analysis, Jillian would pose a challenge. After providing the analysts with a set of financial data for 13 firms for fiscal year 2019, she challenged the analysts to use their intuition to match each column in the exhibit with one of the industries. Case Synopsis Jillian Herbert Head of Talent Development XYZ Bank 13 Industries Airline Railway Drug Manufacturer Commercial Bank Consumer Electronics Discount Retailer Electric Utility Fast Food Restaurant Internet Retailer Wholesale Food Distributor Grocery Store Advertising Agency Software Developer Exhibit 1-Common Size Statements Common Size Balance Sheet Company Year End 1 2 3 4 5 6 7 8 9 10 11 12 13 31-Dec 1-Feb 29-Nov 31-Dec 31-Dec 31-Dec 1-Feb 31-Dec 28-Sep 31-Dec 29-Jun 31-Dec 31-Dec Assets Cash 1.7% 3.5% 20.1% 6.6% 16.1% 5.1% 6.0% 24.4% 29.7% 12.4% 2.9% 3.1% 1.9% AR 2.1% 3.8% 7.4% 2.9% 29.2% 2.6% 0.0% 9.2% 6.8% 8.0% 23.3% 64.0% 4.7% Inv. 0.6% 15.7% 0.0% 3.1% 4.7% 0.7% 21.0% 9.1% 1.2% 7.1% 17.9% 0.0% 0.1% Other CA 2.9% 1.2% 3.8% 1.0% 4.4% 0.2% 3.1% 0.0% 10.4% 5.1% 1.3% 22.6% 0.8% Total Current Assets 7.4% 24.1% 31.3% 13.7% 54.5% 8.6% 30.2% 42.8% 48.1% 32.6% 45.3% 89.7% 7.5% Net PP&E 75.6% 63.4% 6.2% 72.9% 7.7% 84.1% 66.7% 43.4% 11.0% 17.8% 25.1% 1.7% 78.8% Goodwill 0.8% 6.8% 51.5% 6.8% 35.2% 0.0% 0.0% 6.6% 0.0% 23.0% 21.7% 2.5% 5.6% Intangibles & Other 16.3% 5.8% 11.0% 6.6% 2.6% 7.3% 3.2% 7.2% 40.9% 26.6% 7.9% 6.1% 8.1% Total Assets 100.0% 100.0% 100.0% 100.0% 100.0% 100.0% 100.0% 100.0% 100.0% 100.0% 100.0% 100.0% 100.0% Liabilities AP 2.0% 14.0% 1.0% 3.4% 43.9% 2.7% 23.2% 20.9% 13.7% 4.4% 24.0% 75.0% 2.1% ST Debt 5.4% 5.7% 15.2% 4.8% 2.3% 0.6% 0.4% 6.4% 3.0% 4.3% 0.2% 0.8% 0.1% Other CL 3.4% 11.8% 23.3% 22.3% 13.4% 2.3% 10.3% 11.7% 14.5% 17.6% 9.7% 1.4% 5.4% Total Current Liabilities 10.8% 31.5% 39.4% 30.5% 59.7% 5.6% 33.9% 39.0% 31.2% 26.3% 34.0% 77.2% 7.6% LT Debt 31.9% 41.1% 4.8% 48.1% 25.4% 43.1% 31.8% 28.1% 27.1% 26.9% 45.2% 8.8% 98.7% Other LTL 25.9% 8.4% 5.1% 21.5% 2.3% 20.3% 6.7% 5.4% 14.9% 15.9% 6.7% 1.4% 11.0% Total Liabilities 68.6% 81.1% 49.3% 100.2% 87.4% 69.0% 72.3% 72.4% 73.3% 69.2% 85.9% 87.5% 117.3% Non-Controlling Interest 0.3% -0.1% 0.0% 0.0% 1.9% 0.0% 0.0% 0.0% 0.0% 0.1% 0.2% 0.0% 0.0% Net Contributed Capital Retained Earning + AOCI 12.0% -25.9% -19.8% 6.6% -14.0% 2.9% 14.7% 14.7% 13.3% -17.2% -39.7% 1.0% -123.5% 19.1% 44.9% 70.5% -6.8% 24.7% 28.0% 13.0% 13.4% 13.4% 47.9% 53.6% 11.5% 106.2% Total Equity 31.4% 18.9% 50.7% -0.2% 12.6% 31.0% 27.7% 27.6% 26.7% 30.8% 14.1% 12.5% -17.3% Total Liabilities & Equity 100.0% 100.0% 100.0% 100.0% 100.0% 100.0% 100.0% 100.0% 100.0% 100.0% 100.0% 100.0% 100.0% Key Ratios Exhibit 1-Key Ratios Company Revenue Growth Gross Margin Net Margin (ROS) 1 2 3 4 5 6 7 8 9 10 11 12 13 1.9% 0.4% 23.7% 2.8% -2.2% 10.4% 3.7% 20.5% -2.0% 10.7% 2.4% 22.8% 0.2% 77.5% 22.1% 93.8% -n/a- -n/a- -n/a- 28.9% -3.2% 32.2% 69.9% 19.0% -n/a- 17.6% 11.5% 1.4% 26.4% 3.7% 9.0% 27.9% 4.2% 4.1% 21.2% 21.0% 2.8% 24.7% 28.6% CF From Operations ($ MM) $ 3,134 $ 4,024 $ 4,422 $ 3,815 $ 1,856 $ 4,850 $ 7,117 $ 38,514 $ 69,391 $ 13,440 $ 2,411 $ 1,824 $ 8,122 Asset Turnover 0.22x 2.70x 0.54x 0.76x 0.56x 0.31x 1.83x 1.25x 0.77x 0.55x 3.35x 0.06x 0.44x Return on Assets (ROA) 2.5% 3.7% 14.2% 2.8% 5.0% 8.7% 7.7% 5.1% 16.3% 11.7% 9.3% 1.4% 12.7% Financial Leverage 3.19x 5.28x 1.97x -508.43x 7.94x 3.22x 3.62x 3.63x 3.74x 3.25x 7.08x 7.99x -5.79x Return on Equity (ROE) 7.9% 19.4% 28.0% -1428.8% 39.7% 28.1% 27.7% 18.7% 61.1% 37.9% 66.0% 11.4% -73.4% Current Ratio 0.68 0.76 0.79 0.45 0.91 1.52 0.89 1.10 1.54 1.24 1.33 -n/a- 0.98 AR Days (Recievables Collection) 36 days 5 days Inventory Turnover 3.10x 13.50x 50 days -n/a- 14 days -n/a- 191 days -n/a- 30 days -n/a- Odays 6.10x 27 days 8.10x 32 days 53 days 25 days 4040 days 39 days 35.30x 2.40x 15.10x -n/a- 155.20x Dividend Payout Ratio 64.2% 29.3% 0.0% 10.6% 42.1% 22.9% 40.5% 0.0% 25.6% 57.9% 46.3% 31.1% 59.5% R&D Expense Ratio 0.37% -n/a- 17.28% -n/a- -n/a- -n/a- -n/a- 12.81% 6.23% 21.08% -n/a- -n/a- -n/a-
Expert Answer:

Related Book For 

International Marketing And Export Management
ISBN: 9781292016924
8th Edition
Authors: Gerald Albaum , Alexander Josiassen , Edwin Duerr
Posted Date:
Students also viewed these finance questions
-
The Crazy Eddie fraud may appear smaller and gentler than the massive billion-dollar frauds exposed in recent times, such as Bernie Madoffs Ponzi scheme, frauds in the subprime mortgage market, the...
-
Subject : Strategic Management in a Global Environment Safaricom: Innovative Telecom Solutions to Empower Kenyans As the largest mobile provider in Kenya, Safaricom has touched the lives of Kenyans...
-
There are several types of interviews. List and define the methods of interviewing. List and discuss the different types of employment tests. List and discuss the uses of the performance appraisal -...
-
Do you think companies should be allowed to patent a naturally occurring molecule like botulinum toxin? Why or why not?
-
This diagram shows an arrangement to deflect protons from a source to a detector using a magnetic field. The charge on each proton is +e. A uniform magnetic field exists only within the area shown....
-
What are some of the nonverbal clues to deception?
-
Comparative data on three companies in the same service industry are given below: Required: 1. What advantages are there to breaking down the ROI computation into two separate elements, margin and...
-
What is Online transaction processing and Online Analytical Processing? How are they different?
-
A software company make a Use Case diagram for the university software system as shown in figure below. Assume the following Actors and Use cases are categorized as simple (50%), average (25%) and...
-
A balanced Wheatstone bridge is given in the figure, where the resistances are given as R E 5.0 2 and R, = 7.5 0. Between the points A and B, a 1.0 m-long wire with the cross-sectional area of 3.2 X...
-
As shown in the graph, Voltage versus distance from the negative cathode between two parallel conductors. What is the value of the electric field from a distance 20 to 60 cm. Voltage(volt) 120 100 80...
-
Question 1: Forced and damped oscillation: Consider a series RLC circuit in the shape of a rectangular loop only partly in a B-field which is oscillating with frequency o. The loop extends a distance...
-
5. Six observed hadrons have the quantum numbers (Q,B,S,C,B,T) = (2,1,0,1,0,0), (0,1,-2,1,0,0), (0,0,1,0,-1,0), (0,-1,1,0,0,0), (0,1,-1,1,0,0) and (-1,1,-3,0,0,0), respectively. Identify their quark...
-
Consider j = 22=1 Calculate the Clebsch-Gordan cofficients (:.32,mmlj, m) for j =2 2 (2
-
A plan view of a deck slab supported by beams and girders is shown below. Beams AD, DE, EH, and AH are connected to the columns. There is a load of 50 psf over the entire deck. For this 50 psf load:...
-
Why is inventory management important for merchandising and manufacturing firms and what are the main tradeoffs for firms in managing their inventory?
-
Is it not better for an exporting company to use and objective measure of performance rather than a subjective measure? Discuss.
-
What are the major differences between using letters of credit and bills of exchange (drafts) as procedure for financing exports and receiving payment?
-
What changes would you make in the variables used in Table 5.6 to measure country attractiveness and competitive strength? Explain why you have added or deleted variables to those shown. Table 5.6...
-
Given the four criteria necessary for a sale to be complete, which of the following is not one of those conditions? 1. Delivery has occurred or services rendered. 2. Cash has been collected. 3. The...
-
What is the difference between a business and a pure charity? Between a business and a governmental agency?
-
Will reform have a greater impact on insurers or providers?

Study smarter with the SolutionInn App