

Question: As an analyst intern at JP Morgan Chase, your boss has asked you to complete the ratio analysis shown below for SuperCycles (SC) and a
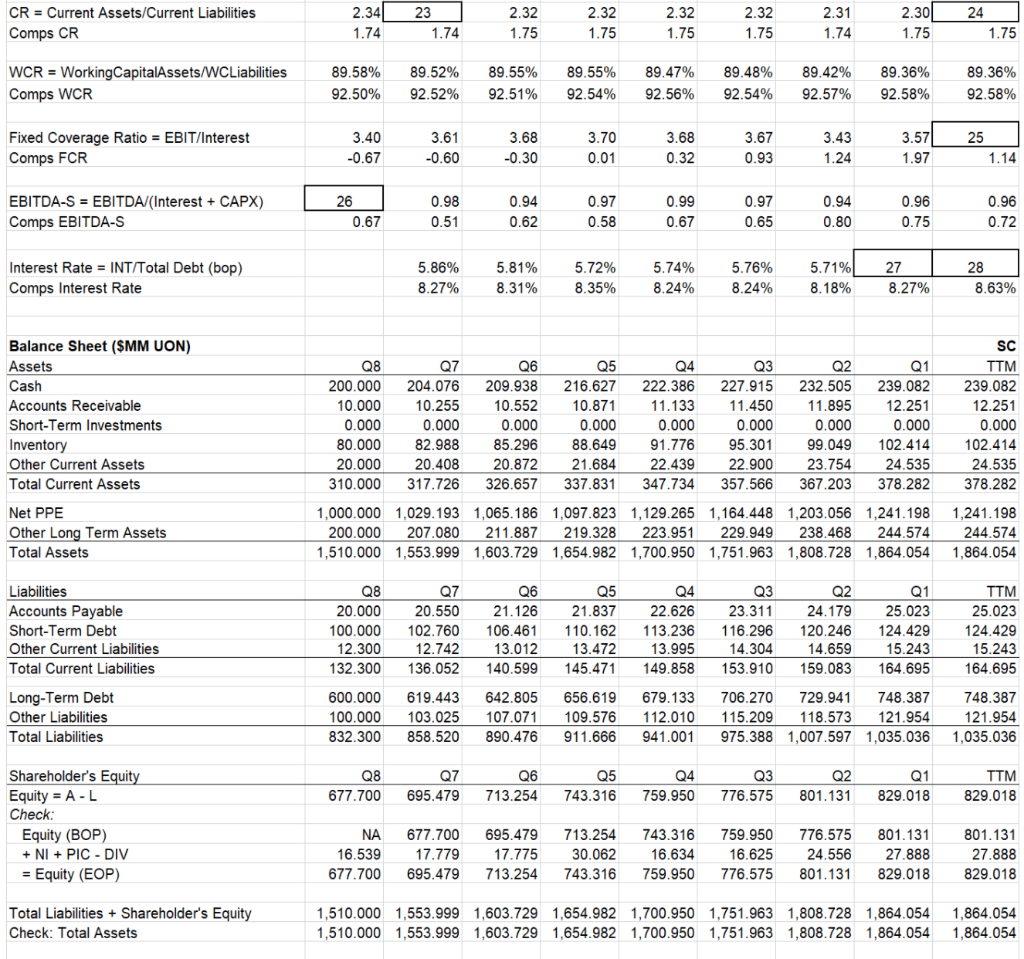
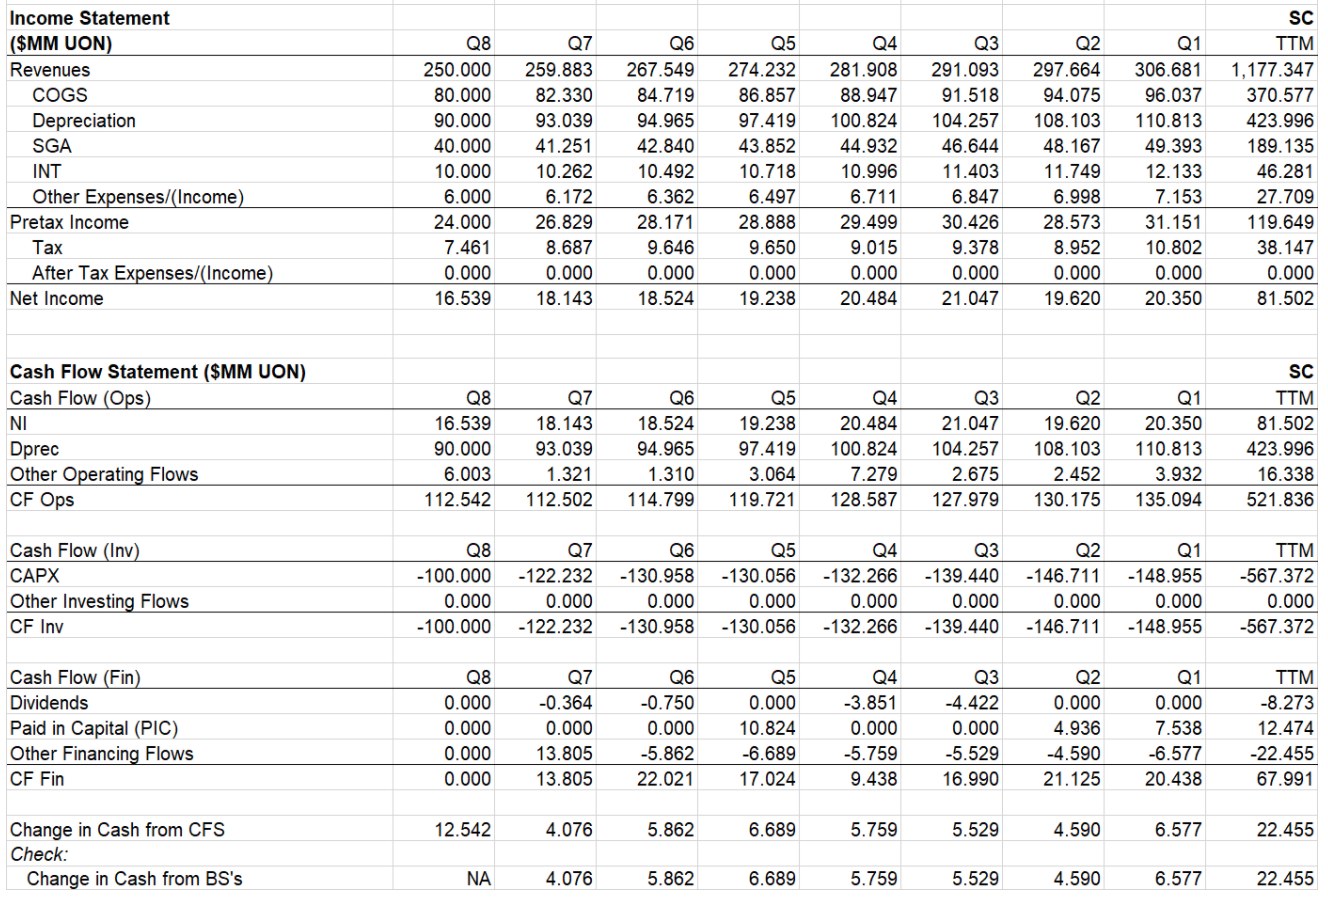
As an analyst intern at JP Morgan Chase, your boss has asked you to complete the ratio analysis shown below for SuperCycles (SC) and a comparable company ("the comp" AKA Zero Motorcycles). Because of their international reach, these companies are virtually non-seasonal. Financial Statements for SC are provided below the incomplete ratio analysis.
For questions 21-28 below, fill in the missing ratio by calculating it from the financial statements. Ignore the rest of the missing ratio-analysis-computations.
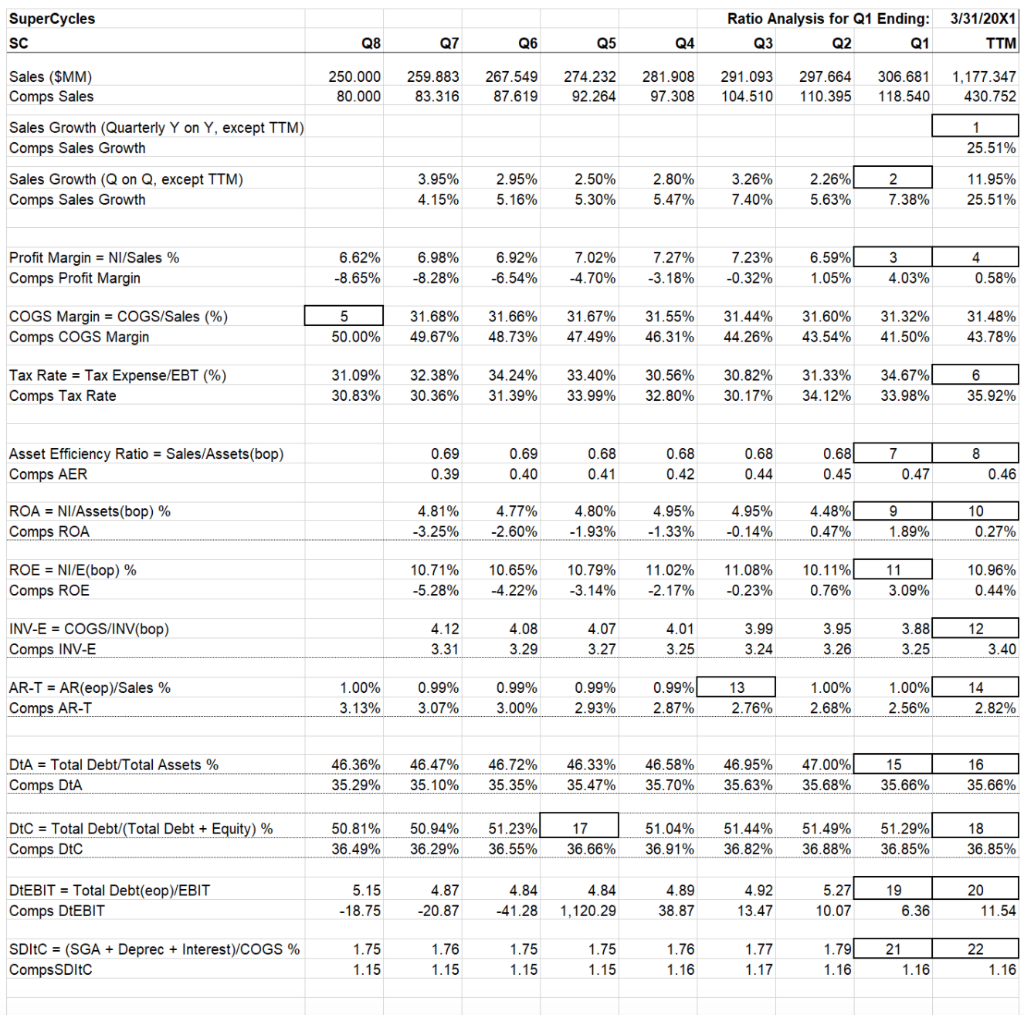
 1. What is ratio 23?
2. What is ratio 24?
3. What is ratio 25?
4. What is ratio 27?
5. What is ratio 28?
SuperCycles SC Ratio Analysis for Q1 Ending: Q3 Q2 Q1 3/31/20X1 TTM Q8 Q7 Q6 Q5 Q4 250.000 80.000 259.883 83.316 267.549 87.619 274.232 92.264 281.908 97.308 291.093 104.510 297.664 110.395 306.681 118.540 1,177.347 430.752 Sales ($MM) Comps Sales Sales Growth (Quarterly Y on Y, except TTM) Comps Sales Growth 1 25.51% Sales Growth (Q on Q, except TTM) Comps Sales Growth 3.95% 4.15% 2.95% 5.16% 2.50% 5.30% 2.80% 5.47% 3.26% 7.40% 2.26% 5.63% 2 7.38% 11.95% 25.51% Profit Margin = NI/Sales % Comps Profit Margin 6.62% -8.65% 6.98% -8.28% 6.92% -6.54% 7.02% -4.70% 7.27% -3.18% 7.23% -0.32% 6.59% 1.05% 3 4.03% 4 0.58% COGS Margin = COGS/Sales (%) Comps COGS Margin 5 50.00% 31.68% 49.67% 31.66% 48.73% 31.67% 47.49% 31.55% 46.31% 31.44% 44.26% 31.60% 43.54% 31.32% 41.50% 31.48% 43.78% 31.09% Tax Rate = Tax Expense/EBT (%) Comps Tax Rate 32.38% 30.36% 34.24% 31.39% 33.40% 33.99% 30.56% 32.80% 30.82% 30.17% 31.33% 34.12% 34.67% 33.98% 6 35.92% 30.83% Asset Efficiency Ratio = Sales/Assets(bop) Comps AER 0.69 0.39 0.69 0.40 0.68 0.41 0.68 0.42 0.68 0.44 0.68 0.45 7 0.47 8 0.46 4.81% ROA = NI/Assets(bop) % Comps ROA 4.77% -2.60% 4.80% -1.93% 4.95% -1.33% 4.95% -0.14% 4.48% 0.47% 9 1.89% 10 0.27% -3.25% ROE = NI/E(bop) % Comps ROE 10.71% -5.28% 10.65% -4.22% 10.79% -3.14% 11.02% -2.17% 11.08% -0.23% 10.11% 0.76% 11 3.09% 10.96% 0.44% 3.881 INV-E = COGS/INV(bop) Comps INV-E 4.12 3.31 4.08 3.29 4.07 3.27 4.01 3.25 3.99 3.24 3.95 3.26 12 3.40 3.25 14 AR-T = AR(eop/Sales % Comps AR-T 1.00% 3.13% 0.99% 3.07% 0.99% 3.00% 0.99% 2.93% 0.99% 2.87% 13 2.76% 1.00% 2.68% 1.00% 2.56% 2.82% DtA = Total Debt/Total Assets % Comps DIA 46.36% 35.29% 46.47% 35.10% 46.72% 35.35% 46.33% 35.47% 46.58% 35.70% 46.95% 35.63% 47.00% 35.68% 15 35.66% 16 35.66% DtC = Total Debt/(Total Debt + Equity) % Comps DtC 50.81% 36.49% 50.94% 36.29% 51.23% 36.55% 17 36.66% 51.04% 36.91% 51.44% 36.82% 51.49% 36.88% 51.29% 36.85% 18 36.85% DEBIT = Total Debt(eop)/EBIT Comps DEBIT 5.15 -18.75 4.87 -20.87 4.84 -41.28 4.84 1,120.29 4.89 38.87 4.92 13.47 5.271 10.07 19 6.36 20 11.54 22 SDItC = (SGA + Deprec + Interest)/COGS % Comps SDItc 1.75 1.15 1.76 1.15 1.75 1.15 1.75 1.15 1.76 1.16 1.77 1.17 1.79 1.16 21 1.16 1.16 2.32 2.32 CR = Current Assets/Current Liabilities Comps CR 2.341 1.74 23 1.74 2.32 1.75 2.32 1.75 2.31 1.74 2.30 1.75 24 1.75 1.75 1.75 WCR = Working CapitalAssets/WCLiabilities Comps WCR 89.58% 92.50% 89.52% 92.52% 89.55% 92.51% 89.55% 92.54% 89.47% 92.56% 89.48% 92.54% 89.42% 92.57% 89.36% 92.58% 89.36% 92.58% 25 Fixed Coverage Ratio = EBIT/Interest Comps FCR 3.40 -0.67 3.61 -0.60 3.68 -0.30 3.70 0.01 3.68 0.32 3.67 0.93 3.43 1.24 3.57 1.97 1.14 0.97 EBITDA-S = EBITDA/(Interest + CAPX) Comps EBITDA-S 26 0.67 0.98 0.51 0.94 0.62 0.99 0.67 0.97 0.65 0.94 0.80 0.96 0.75 0.96 0.72 0.58 Interest Rate = INT/Total Debt (bop) Comps Interest Rate 5.86% 8.27% 5.81% 8.31% 5.72% 8.35% 5.74% 8.24% 5.76% 8.24% 5.71% 8.18% 27 8.27% 28 8.63% Balance Sheet ($MM UON) Assets Cash Accounts Receivable Short-Term Investments Inventory Other Current Assets Total Current Assets Q8 Q7 Q6 Q5 Q4 Q3 Q2 Q1 200.000 204.076 209.938 216.627 222.386 227.915 232.505 239.082 10.000 10.255 10.552 10.871 11.133 11.450 11.895 12.251 0.000 0.000 0.000 0.000 0.000 0.000 0.000 0.000 80.000 82.988 85.296 88.649 91.776 95.301 99.049 102.414 20.000 20.408 20.872 21.684 22.439 22.900 23.754 24.535 310.000 317.726 326.657 337.831 347.734 357.566 367.203 378.282 1,000.000 1,029.193 1,065.186 1,097.823 1,129.265 1,164.448 1,203.056 1,241.198 200.000 207.080 211.887 219.328 223.951 229.949 238.468 244.574 1,510.000 1,553.999 1,603.729 1,654.982 1,700.950 1,751.963 1,808.728 1,864.054 SC TTM 239.082 12.251 0.000 102.414 24.535 378.282 Net PPE Other Long Term Assets Total Assets 1,241.198 244.574 1,864.054 Liabilities Accounts Payable Short-Term Debt Other Current Liabilities Total Current Liabilities Long-Term Debt Other Liabilities Total Liabilities Q8 20.000 100.000 12.300 132.300 Q7 20.550 102.760 12.742 136.052 Q6 21.126 106.461 13.012 140.599 Q5 21.837 110.162 13.472 145.471 Q4 22.626 113.236 13.995 149.858 Q3 23.311 116.296 14.304 153.910 Q2 24.179 120.246 14.659 159.083 Q1 25.023 124.429 15.243 164.695 TTM 25.023 124.429 15.243 164.695 600.000 100.000 832.300 619.443 103.025 858.520 642.805 107.071 890.476 656.619 109.576 911.666 679.133 112.010 941.001 706.270 729.941 748.387 115.209 118.573 121.954 975.388 1,007.597 1,035.036 748.387 121.954 1,035.036 Q8 677.700 Q7 695.479 Q6 713.254 Q5 743.316 Q4 759.950 Q3 776.575 Q2 801.131 Q1 829.018 TTM 829.018 Shareholder's Equity Equity = A -L Check: Equity (BOP) + NI + PIC - DIV = Equity (EOP) NA 16.539 677.700 17.779 695.479 695.479 17.775 713.254 713.254 30.062 743 743.316 16.634 759. 759.950 16.625 776.575 24.556 801.131 801.131 27.888 829.018 801.131 27.888 829.018 Total Liabilities + Shareholder's Equity Check: Total Assets 1,510.000 1,553.999 1,603.729 1,654.982 1,700.950 1,751.963 1,808.728 1,864.054 1,510.000 1,553.999 1,603.729 1,654.982 1,700.950 1,751.963 1,808.728 1,864.054 1,864.054 1,864.054 Income Statement ($MM UON) Revenues COGS Depreciation SGA INT Other Expenses/(Income) Pretax Income Tax After Tax Expenses/(Income) Net Income Q8 250.000 80.000 90.000 40.000 10.000 6.000 24.000 7.461 0.000 16.539 Q7 259.883 82.330 93.039 41.251 10.262 6.172 26.829 8.687 0.000 18.143 Q6 267.549 84.719 94.965 42.840 10.492 6.362 28.171 9.646 0.000 18.524 Q5 274.232 86.857 97.419 43.852 10.718 6.497 28.888 9.650 0.000 19.238 Q4 281.908 88.947 100.824 44.932 10.996 6.711 29.499 9.015 0.000 20.484 Q3 291.093 91.518 104.257 46.644 11.403 6.847 30.426 9.378 0.000 21.047 Q2 297.664 94.075 108.103 48.167 11.749 6.998 28.573 8.952 0.000 19.620 Q1 306.681 96.037 110.813 49.393 12.133 7.153 31.151 10.802 0.000 20.350 SC TTM 1,177.347 370.577 423.996 189.135 46.281 27.709 119.649 38.147 0.000 81.502 Cash Flow Statement ($MM UON) Cash Flow (Ops) NI Dprec Other Operating Flows CF Ops Q8 16.539 90.000 6.003 112.542 Q7 18.143 93.039 1.321 112.502 Q6 18.524 94.965 1.310 114.799 Q5 19.238 97.419 3.064 119.721 Q4 20.484 100.824 7.279 128.587 Q3 21.047 104.257 2.675 127.979 Q2 19.620 108.103 2.452 130.175 Q1 20.350 110.813 3.932 135.094 SC TTM 81.502 423.996 16.338 521.836 Cash Flow (Inv) CAPX Other Investing Flows CF Inv Q8 -100.000 0.000 -100.000 Q7 -122.232 0.000 -122.232 Q6 -130.958 0.000 -130.958 Q5 -130.056 0.000 -130.056 Q4 -132.266 0.000 -132.266 Q3 -139.440 0.000 -139.440 Q2 -146.711 0.000 -146.711 Q1 -148.955 0.000 -148.955 TTM -567.372 0.000 -567.372 Cash Flow (Fin) Dividends Paid in Capital (PIC) Other Financing Flows CF Fin Q8 0.000 0.000 0.000 0.000 Q7 -0.364 0.000 13.805 13.805 Q6 -0.750 0.000 -5.862 22.021 Q5 0.000 10.824 -6.689 17.024 Q4 -3.851 0.000 -5.759 9.438 Q3 -4.422 0.000 -5.529 16.990 Q2 0.000 4.936 -4.590 21.125 Q1 0.000 7.538 -6.577 20.438 TTM -8.273 12.474 -22.455 67.991 12.542 4.076 5.862 6.689 5.759 5.529 4.590 6.577 22.455 Change in Cash from CFS Check: Change in Cash from BS's NA 4.076 5.862 6.689 5.759 5.529 4.590 6.577 22.455 SuperCycles SC Ratio Analysis for Q1 Ending: Q3 Q2 Q1 3/31/20X1 TTM Q8 Q7 Q6 Q5 Q4 250.000 80.000 259.883 83.316 267.549 87.619 274.232 92.264 281.908 97.308 291.093 104.510 297.664 110.395 306.681 118.540 1,177.347 430.752 Sales ($MM) Comps Sales Sales Growth (Quarterly Y on Y, except TTM) Comps Sales Growth 1 25.51% Sales Growth (Q on Q, except TTM) Comps Sales Growth 3.95% 4.15% 2.95% 5.16% 2.50% 5.30% 2.80% 5.47% 3.26% 7.40% 2.26% 5.63% 2 7.38% 11.95% 25.51% Profit Margin = NI/Sales % Comps Profit Margin 6.62% -8.65% 6.98% -8.28% 6.92% -6.54% 7.02% -4.70% 7.27% -3.18% 7.23% -0.32% 6.59% 1.05% 3 4.03% 4 0.58% COGS Margin = COGS/Sales (%) Comps COGS Margin 5 50.00% 31.68% 49.67% 31.66% 48.73% 31.67% 47.49% 31.55% 46.31% 31.44% 44.26% 31.60% 43.54% 31.32% 41.50% 31.48% 43.78% 31.09% Tax Rate = Tax Expense/EBT (%) Comps Tax Rate 32.38% 30.36% 34.24% 31.39% 33.40% 33.99% 30.56% 32.80% 30.82% 30.17% 31.33% 34.12% 34.67% 33.98% 6 35.92% 30.83% Asset Efficiency Ratio = Sales/Assets(bop) Comps AER 0.69 0.39 0.69 0.40 0.68 0.41 0.68 0.42 0.68 0.44 0.68 0.45 7 0.47 8 0.46 4.81% ROA = NI/Assets(bop) % Comps ROA 4.77% -2.60% 4.80% -1.93% 4.95% -1.33% 4.95% -0.14% 4.48% 0.47% 9 1.89% 10 0.27% -3.25% ROE = NI/E(bop) % Comps ROE 10.71% -5.28% 10.65% -4.22% 10.79% -3.14% 11.02% -2.17% 11.08% -0.23% 10.11% 0.76% 11 3.09% 10.96% 0.44% 3.881 INV-E = COGS/INV(bop) Comps INV-E 4.12 3.31 4.08 3.29 4.07 3.27 4.01 3.25 3.99 3.24 3.95 3.26 12 3.40 3.25 14 AR-T = AR(eop/Sales % Comps AR-T 1.00% 3.13% 0.99% 3.07% 0.99% 3.00% 0.99% 2.93% 0.99% 2.87% 13 2.76% 1.00% 2.68% 1.00% 2.56% 2.82% DtA = Total Debt/Total Assets % Comps DIA 46.36% 35.29% 46.47% 35.10% 46.72% 35.35% 46.33% 35.47% 46.58% 35.70% 46.95% 35.63% 47.00% 35.68% 15 35.66% 16 35.66% DtC = Total Debt/(Total Debt + Equity) % Comps DtC 50.81% 36.49% 50.94% 36.29% 51.23% 36.55% 17 36.66% 51.04% 36.91% 51.44% 36.82% 51.49% 36.88% 51.29% 36.85% 18 36.85% DEBIT = Total Debt(eop)/EBIT Comps DEBIT 5.15 -18.75 4.87 -20.87 4.84 -41.28 4.84 1,120.29 4.89 38.87 4.92 13.47 5.271 10.07 19 6.36 20 11.54 22 SDItC = (SGA + Deprec + Interest)/COGS % Comps SDItc 1.75 1.15 1.76 1.15 1.75 1.15 1.75 1.15 1.76 1.16 1.77 1.17 1.79 1.16 21 1.16 1.16 2.32 2.32 CR = Current Assets/Current Liabilities Comps CR 2.341 1.74 23 1.74 2.32 1.75 2.32 1.75 2.31 1.74 2.30 1.75 24 1.75 1.75 1.75 WCR = Working CapitalAssets/WCLiabilities Comps WCR 89.58% 92.50% 89.52% 92.52% 89.55% 92.51% 89.55% 92.54% 89.47% 92.56% 89.48% 92.54% 89.42% 92.57% 89.36% 92.58% 89.36% 92.58% 25 Fixed Coverage Ratio = EBIT/Interest Comps FCR 3.40 -0.67 3.61 -0.60 3.68 -0.30 3.70 0.01 3.68 0.32 3.67 0.93 3.43 1.24 3.57 1.97 1.14 0.97 EBITDA-S = EBITDA/(Interest + CAPX) Comps EBITDA-S 26 0.67 0.98 0.51 0.94 0.62 0.99 0.67 0.97 0.65 0.94 0.80 0.96 0.75 0.96 0.72 0.58 Interest Rate = INT/Total Debt (bop) Comps Interest Rate 5.86% 8.27% 5.81% 8.31% 5.72% 8.35% 5.74% 8.24% 5.76% 8.24% 5.71% 8.18% 27 8.27% 28 8.63% Balance Sheet ($MM UON) Assets Cash Accounts Receivable Short-Term Investments Inventory Other Current Assets Total Current Assets Q8 Q7 Q6 Q5 Q4 Q3 Q2 Q1 200.000 204.076 209.938 216.627 222.386 227.915 232.505 239.082 10.000 10.255 10.552 10.871 11.133 11.450 11.895 12.251 0.000 0.000 0.000 0.000 0.000 0.000 0.000 0.000 80.000 82.988 85.296 88.649 91.776 95.301 99.049 102.414 20.000 20.408 20.872 21.684 22.439 22.900 23.754 24.535 310.000 317.726 326.657 337.831 347.734 357.566 367.203 378.282 1,000.000 1,029.193 1,065.186 1,097.823 1,129.265 1,164.448 1,203.056 1,241.198 200.000 207.080 211.887 219.328 223.951 229.949 238.468 244.574 1,510.000 1,553.999 1,603.729 1,654.982 1,700.950 1,751.963 1,808.728 1,864.054 SC TTM 239.082 12.251 0.000 102.414 24.535 378.282 Net PPE Other Long Term Assets Total Assets 1,241.198 244.574 1,864.054 Liabilities Accounts Payable Short-Term Debt Other Current Liabilities Total Current Liabilities Long-Term Debt Other Liabilities Total Liabilities Q8 20.000 100.000 12.300 132.300 Q7 20.550 102.760 12.742 136.052 Q6 21.126 106.461 13.012 140.599 Q5 21.837 110.162 13.472 145.471 Q4 22.626 113.236 13.995 149.858 Q3 23.311 116.296 14.304 153.910 Q2 24.179 120.246 14.659 159.083 Q1 25.023 124.429 15.243 164.695 TTM 25.023 124.429 15.243 164.695 600.000 100.000 832.300 619.443 103.025 858.520 642.805 107.071 890.476 656.619 109.576 911.666 679.133 112.010 941.001 706.270 729.941 748.387 115.209 118.573 121.954 975.388 1,007.597 1,035.036 748.387 121.954 1,035.036 Q8 677.700 Q7 695.479 Q6 713.254 Q5 743.316 Q4 759.950 Q3 776.575 Q2 801.131 Q1 829.018 TTM 829.018 Shareholder's Equity Equity = A -L Check: Equity (BOP) + NI + PIC - DIV = Equity (EOP) NA 16.539 677.700 17.779 695.479 695.479 17.775 713.254 713.254 30.062 743 743.316 16.634 759. 759.950 16.625 776.575 24.556 801.131 801.131 27.888 829.018 801.131 27.888 829.018 Total Liabilities + Shareholder's Equity Check: Total Assets 1,510.000 1,553.999 1,603.729 1,654.982 1,700.950 1,751.963 1,808.728 1,864.054 1,510.000 1,553.999 1,603.729 1,654.982 1,700.950 1,751.963 1,808.728 1,864.054 1,864.054 1,864.054 Income Statement ($MM UON) Revenues COGS Depreciation SGA INT Other Expenses/(Income) Pretax Income Tax After Tax Expenses/(Income) Net Income Q8 250.000 80.000 90.000 40.000 10.000 6.000 24.000 7.461 0.000 16.539 Q7 259.883 82.330 93.039 41.251 10.262 6.172 26.829 8.687 0.000 18.143 Q6 267.549 84.719 94.965 42.840 10.492 6.362 28.171 9.646 0.000 18.524 Q5 274.232 86.857 97.419 43.852 10.718 6.497 28.888 9.650 0.000 19.238 Q4 281.908 88.947 100.824 44.932 10.996 6.711 29.499 9.015 0.000 20.484 Q3 291.093 91.518 104.257 46.644 11.403 6.847 30.426 9.378 0.000 21.047 Q2 297.664 94.075 108.103 48.167 11.749 6.998 28.573 8.952 0.000 19.620 Q1 306.681 96.037 110.813 49.393 12.133 7.153 31.151 10.802 0.000 20.350 SC TTM 1,177.347 370.577 423.996 189.135 46.281 27.709 119.649 38.147 0.000 81.502 Cash Flow Statement ($MM UON) Cash Flow (Ops) NI Dprec Other Operating Flows CF Ops Q8 16.539 90.000 6.003 112.542 Q7 18.143 93.039 1.321 112.502 Q6 18.524 94.965 1.310 114.799 Q5 19.238 97.419 3.064 119.721 Q4 20.484 100.824 7.279 128.587 Q3 21.047 104.257 2.675 127.979 Q2 19.620 108.103 2.452 130.175 Q1 20.350 110.813 3.932 135.094 SC TTM 81.502 423.996 16.338 521.836 Cash Flow (Inv) CAPX Other Investing Flows CF Inv Q8 -100.000 0.000 -100.000 Q7 -122.232 0.000 -122.232 Q6 -130.958 0.000 -130.958 Q5 -130.056 0.000 -130.056 Q4 -132.266 0.000 -132.266 Q3 -139.440 0.000 -139.440 Q2 -146.711 0.000 -146.711 Q1 -148.955 0.000 -148.955 TTM -567.372 0.000 -567.372 Cash Flow (Fin) Dividends Paid in Capital (PIC) Other Financing Flows CF Fin Q8 0.000 0.000 0.000 0.000 Q7 -0.364 0.000 13.805 13.805 Q6 -0.750 0.000 -5.862 22.021 Q5 0.000 10.824 -6.689 17.024 Q4 -3.851 0.000 -5.759 9.438 Q3 -4.422 0.000 -5.529 16.990 Q2 0.000 4.936 -4.590 21.125 Q1 0.000 7.538 -6.577 20.438 TTM -8.273 12.474 -22.455 67.991 12.542 4.076 5.862 6.689 5.759 5.529 4.590 6.577 22.455 Change in Cash from CFS Check: Change in Cash from BS's NA 4.076 5.862 6.689 5.759 5.529 4.590 6.577 22.455
Step by Step Solution
There are 3 Steps involved in it

Get step-by-step solutions from verified subject matter experts