

Question: As Reported Microsoft's Quarterly Balance Sheet Report Date 03/31/2023 3rd Quarter Currency USD Audit Status Unaudited Consolidated Yes Scale Thousands Cash & cash equivalents 26,562,000
As Reported Microsoft's Quarterly Balance Sheet Report Date 03/31/2023 3rd Quarter Currency USD Audit Status Unaudited Consolidated Yes Scale Thousands Cash & cash equivalents 26,562,000 Short-term investments 77,865,000 Total cash, cash equivalents, & short-term investments 104,427,000 Accounts receivable, gross 37,915,000 Allowance for doubtful accounts 495,000 Accounts receivable, net 37,420,000 Raw materials 1,055,000 Work in process 35,000 Finished goods 1,787,000 Inventories 2,877,000 Other current assets 19,165,000 Total current assets 163,889,000 Property & equipment, gross 154,130,000 Accumulated depreciation 65,998,000 Property & equipment, net 88,132,000 Operating lease right-of -use assets 13,879,000 Equity investments 9,415,000 Goodwill 67,940,000 Intangible assets, net 9,879,000 Other long-term assets 26,954,000 Total assets 380,088,000 Accounts payable 15,305,000 Current portion of long-term debt 6,245,000 Accrued compensation 10,411,000 Short-term income taxes 4,163,000 Short-term unearned revenue 36,903,000 Other current liabilities 12,664,000 Total current liabilities 85,691,000 Debt - 53,812,000 Senior unsecured obligations 53,856,000 Unamortized discount & issuance costs (446,000) Hedge fair value adjustments (88,000) Premium on debt exchange (5,112,000) Total debt 48,210,000 Less: current portion of long-term debt 6,245,000 Long-term debt 41,965,000 Long-term income taxes 25,000,000 Long-term unearned revenue 2,698,000 Deferred income taxes 302,000 Operating lease liabilities 12,312,000 Other long-term liabilities 17,437,000 Total liabilities 185,405,000 Common stock & paid-in capital 92,093,000 Retained earnings (accumulated deficit) 108,234,000 Derivatives (47,000) Investments (2,934,000) Translation adjustments & other accumulated comprehensive income (2,663,000) Accumulated other comprehensive income (loss) (5,644,000) Total stockholders' equity 194,683,000 As Reported Microsoft's Quarterly Income Statement Report Date 03/31/2023 3rd Quarter Currency USD Audit Status Unaudited Consolidated Yes Scale Thousands Product revenue 15,588,000 Service & other revenue 37,269,000 Total revenue 52,857,000 Cost of product revenue 3,941,000 Cost of service & other revenue 12,187,000 Total cost of revenue 16,128,000 Gross margin 36,729,000 Research & development 6,984,000 Sales & marketing 5,750,000 General & administrative 1,643,000 Operating income (loss) 22,352,000 Interest & dividends income 748,000 Interest expense 496,000 Net recognized gains (losses) on investments 105,000 Net gains (losses) on derivatives (65,000) Net gains (losses) on foreign currency remeasurements 122,000 Other income (expense), net (93,000) Other income (expense), net 321,000 Income (loss) before income taxes 22,673,000 Provision for income taxes 4,374,000 Net income (loss) 18,299,000 Net income (loss) available for common shareholders 18,299,000 Weighted average shares outstanding - basic 7,441,000 Weighted average shares outstanding - diluted 7,464,000 Year end shares outstanding 7,437,000 Net income (loss) per share - basic 2.46 Net income (loss) per share - diluted 2.45 Cash dividends declared per common share 0.68 As Reported Microsoft's Quarterly Retained Earnings Report Date 03/31/2023 3rd Quarter Currency USD Audit Status Unaudited Consolidated Yes Scale Thousands Previous retained earnings (accumulated deficit) 99,368,000 Common stock cash dividends 5,053,000 Common stock repurchased 4,380,000 Retained earnings (accumulated deficit) 108,234,000 As Reported Microsoft's Quarterly Cash Flow Report Date 03/31/2023 3rd Quarter Currency USD Audit Status Unaudited Consolidated Yes Scale Thousands Net income (loss) 52,280,000 Depreciation, amortization, & other adjustments 9,987,000 Stock-based compensation expense 7,195,000 Net recognized losses (gains) on investments & derivatives 152,000 Deferred income taxes (4,171,000) Accounts receivable 7,157,000 Inventories 868,000 Other current assets 428,000 Other long-term assets (1,285,000) Accounts payable (4,032,000) Unearned revenue (8,689,000) Income taxes (1,039,000) Other current liabilities (490,000) Other long-term liabilities 451,000 Net cash flows from operating activities 58,812,000 Repayments of debt (1,750,000) Common stock issued 1,354,000 Common stock repurchased (16,541,000) Common stock cash dividends paid (14,746,000) Other financing activities, net (839,000) Net cash flows from financing activities (32,522,000) Additions to property & equipment (19,164,000) Acquisition of companies, net of cash acquired, & purchases of intangible & other assets (1,329,000) Purchases of investments (25,675,000) Maturities of investments 26,744,000 Sales of investments 8,725,000 Other investing activities, net (2,847,000) Net cash flows from investing activities (13,546,000) Effect of foreign exchange rates on cash & cash equivalents (113,000) Net change in cash & cash equivalents 12,631,000 Cash & cash equivalents, beginning of period 13,931,000 Cash & cash equivalents, end of period 26,562,000
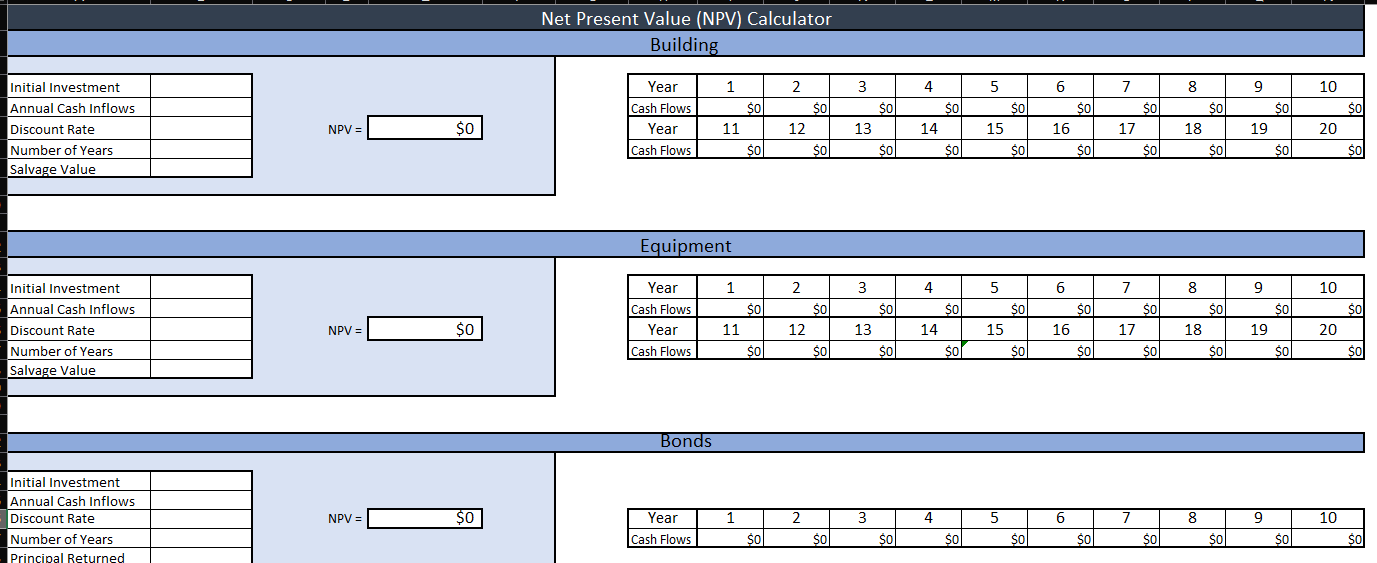
Net Present Value (NPV) Calculator Net Present Value (NPV) Calculator
Step by Step Solution
There are 3 Steps involved in it

Get step-by-step solutions from verified subject matter experts