

Question: As the junior portfolio manager, you are given a client portfolio which is made up of a risky funds and risk-free funds. The risky fund
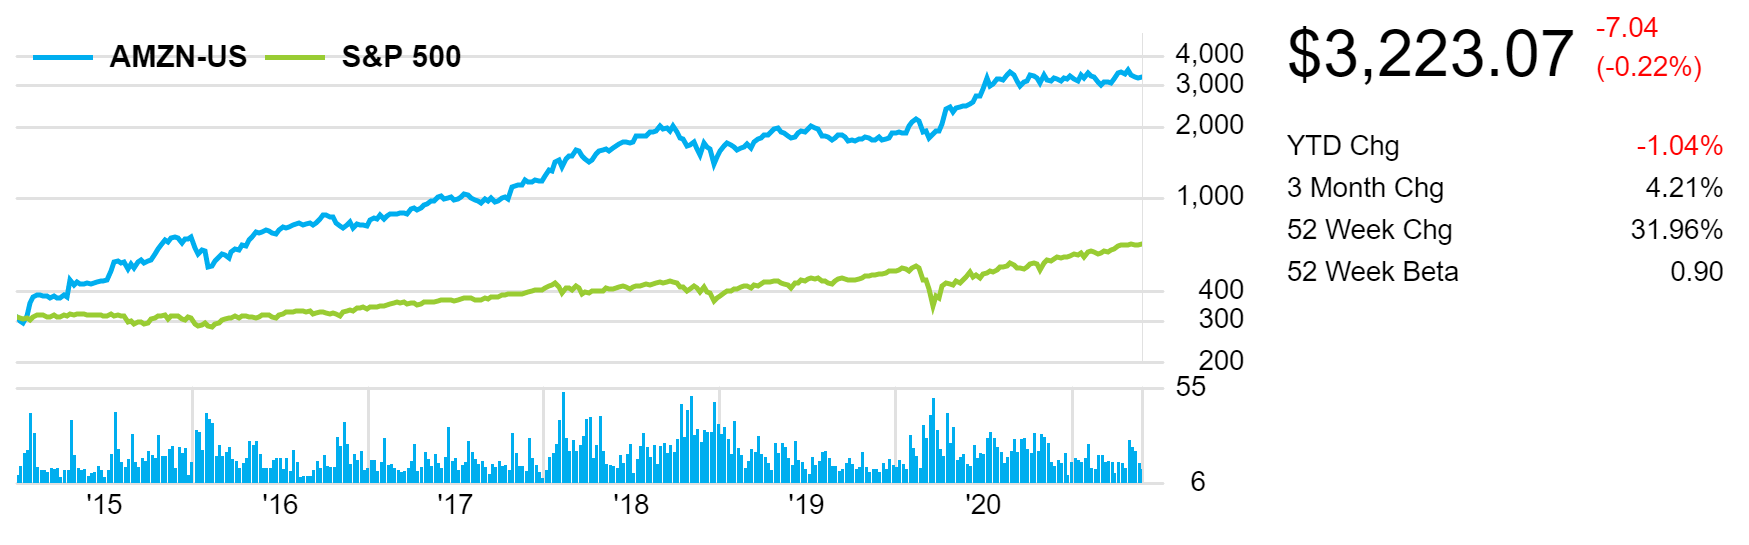
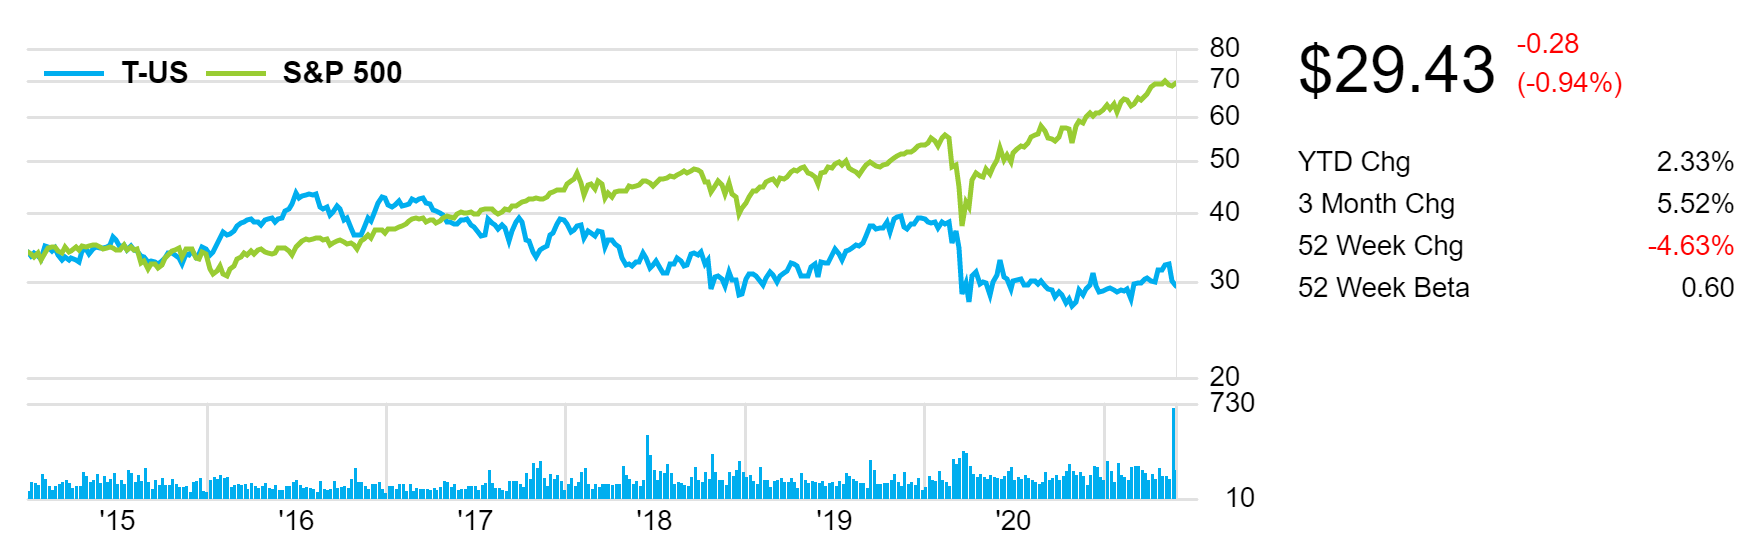
As the junior portfolio manager, you are given a client portfolio which is made up of a risky funds and risk-free funds. The risky fund portfolio comprises stocks from Amazon which is listed as (Nasdaq symbol: AMZN) and stocks from AT&T, Inc. (NYSE symbol: T). Assume the risk-free rate is 1.75%. The stock performance of the two stocks over the last few years is displayed below. As observed, while AMZN had an extraordinary performance over the period 2017-2021, AT&T experienced a less successful increase in its stock prices during the same period. You believe they are a good combination in a risky portfolio.
Amazon.com, Inc. engages in the provision of online retail shopping services. It operates through the following business segments: North America, International, and Amazon Web Services (AWS). The North America segment includes retail sales of consumer products and subscriptions through North America-focused websites such as www.amazon.com and www.amazon.ca. The International segment offers retail sales of consumer products and subscriptions through internationally-focused websites. The Amazon Web Services segment involves in the global sales of compute, storage, database, and AWS service offerings for start-ups, enterprises, government agencies, and academic institutions. The company was founded by Jeffrey P. Bezos in July 1994 and is headquartered in Seattle, WA.
Fig.1 shows the performance of Amazon (2014-2021) relative to the S&P500.
AT&T Inc. (trading as T under NYSE) is a holding company, which engages in the provision of telecommunications media and technology service. It operates through the following four segments: Communications, Warner Media, Latin America and Xandar. The Communications segment provides services to businesses and consumers located in the U.S., or in U.S. territories, and businesses globally. The Warner Media segment develops, produces and distributes feature films, television, gaming and other content over various physical and digital formats. The Latin America segment provides entertainment and wireless services outside of the U.S. The Xandar segment provides advertising services. The company was founded in 1983 and is headquartered in Dallas, TX.
The last 5 years of stock price data is given as follows:
|
|
|
| AMZN |
| T |
|
| Year |
|
| Stock Price ($) | Return (%) | Stock Price ($) | Return (%) |
| May-17 |
|
| 987
|
| 38 |
|
| May-18 |
|
| 1637
|
| 32 |
|
| May-19 |
|
| 1900
|
| 32 |
|
| May-20 |
|
| 2646
| 30.8 |
| |
| May-21 |
|
| 3450
| 29.6 |
|
(a) Estimate the risk and average return for each of the 2 stocks. You can assume arithmetic mean as a measure of average return. [5 marks]
(b) Explain the steps needed to construct an efficient portfolio. No calculation is required here. [5 marks]
(c) Estimate the expected return and risk of the minimum variance portfolio. [4 marks]
(d) Would you recommend a minimum variance portfolio based on the two stocks above or a portfolio with a Sharpe performance value of 2.8? [2 marks]
(e) Based on the current economic climate, would you recommend a risk averse client to tilt his or her investments towards equities or cryptocurrencies? Explain your answer. [3 marks]
(f) You manage 3 clients currently. James, Abdullah and Noof. Abdullahs portfolio has the 2 stocks above with equal weights allocated. There is no risk-free asset in his portfolio. Noofs portfolio, on the other hand, has 70% invested into risky assets, where the risky assets are based on the 2 above stocks. The remaining 30% is invested into 3-month treasury bills, which is proxied as the risk-free asset. James portfolio is a 75% leveraged portfolio with the same 2 stocks as risky assets.
Which portfolio performed better? Part of your answer should include a representation of the 3 clients portfolios on a CAL. Explain your answer. [5 marks]
(g) If you are interested to invest in a portfolio which includes only the U.S. energy sector companies which are listed under the S&P500, provide one ETF which you can use. [1 mark]
-7.04 AMZN-US S&P 500 4,000 $3,223.07 (-0.22%) 3,000 2,000 -1.04% 1,000 YTD Chg 3 Month Chg 52 Week Chg 4.21% 31.96% 52 Week Beta 0.90 400 300 200 55 6 '15 '16 '17 '18 '19 '20 80 -0.28 T-US S&P 500 70 $29.43 (-0.94%) man 60 50 2.33% 40 YTD Chg 3 Month Chg 52 Week Chg 5.52% -4.63% mann . 30 52 Week Beta 0.60 20 730 LTILLmnalilr luillet 10 '15 '16 '17 '18 '19 '20 -7.04 AMZN-US S&P 500 4,000 $3,223.07 (-0.22%) 3,000 2,000 -1.04% 1,000 YTD Chg 3 Month Chg 52 Week Chg 4.21% 31.96% 52 Week Beta 0.90 400 300 200 55 6 '15 '16 '17 '18 '19 '20 80 -0.28 T-US S&P 500 70 $29.43 (-0.94%) man 60 50 2.33% 40 YTD Chg 3 Month Chg 52 Week Chg 5.52% -4.63% mann . 30 52 Week Beta 0.60 20 730 LTILLmnalilr luillet 10 '15 '16 '17 '18 '19 '20
Step by Step Solution
There are 3 Steps involved in it

Get step-by-step solutions from verified subject matter experts