

A nationwide standardized test taken by high- school juniors and seniors may or may not measure...
Fantastic news! We've Found the answer you've been seeking!
Question:
Transcribed Image Text:
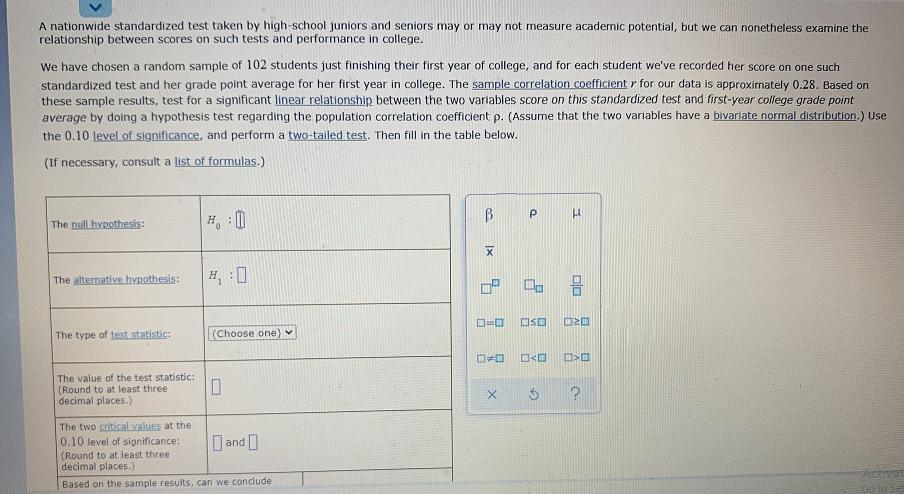
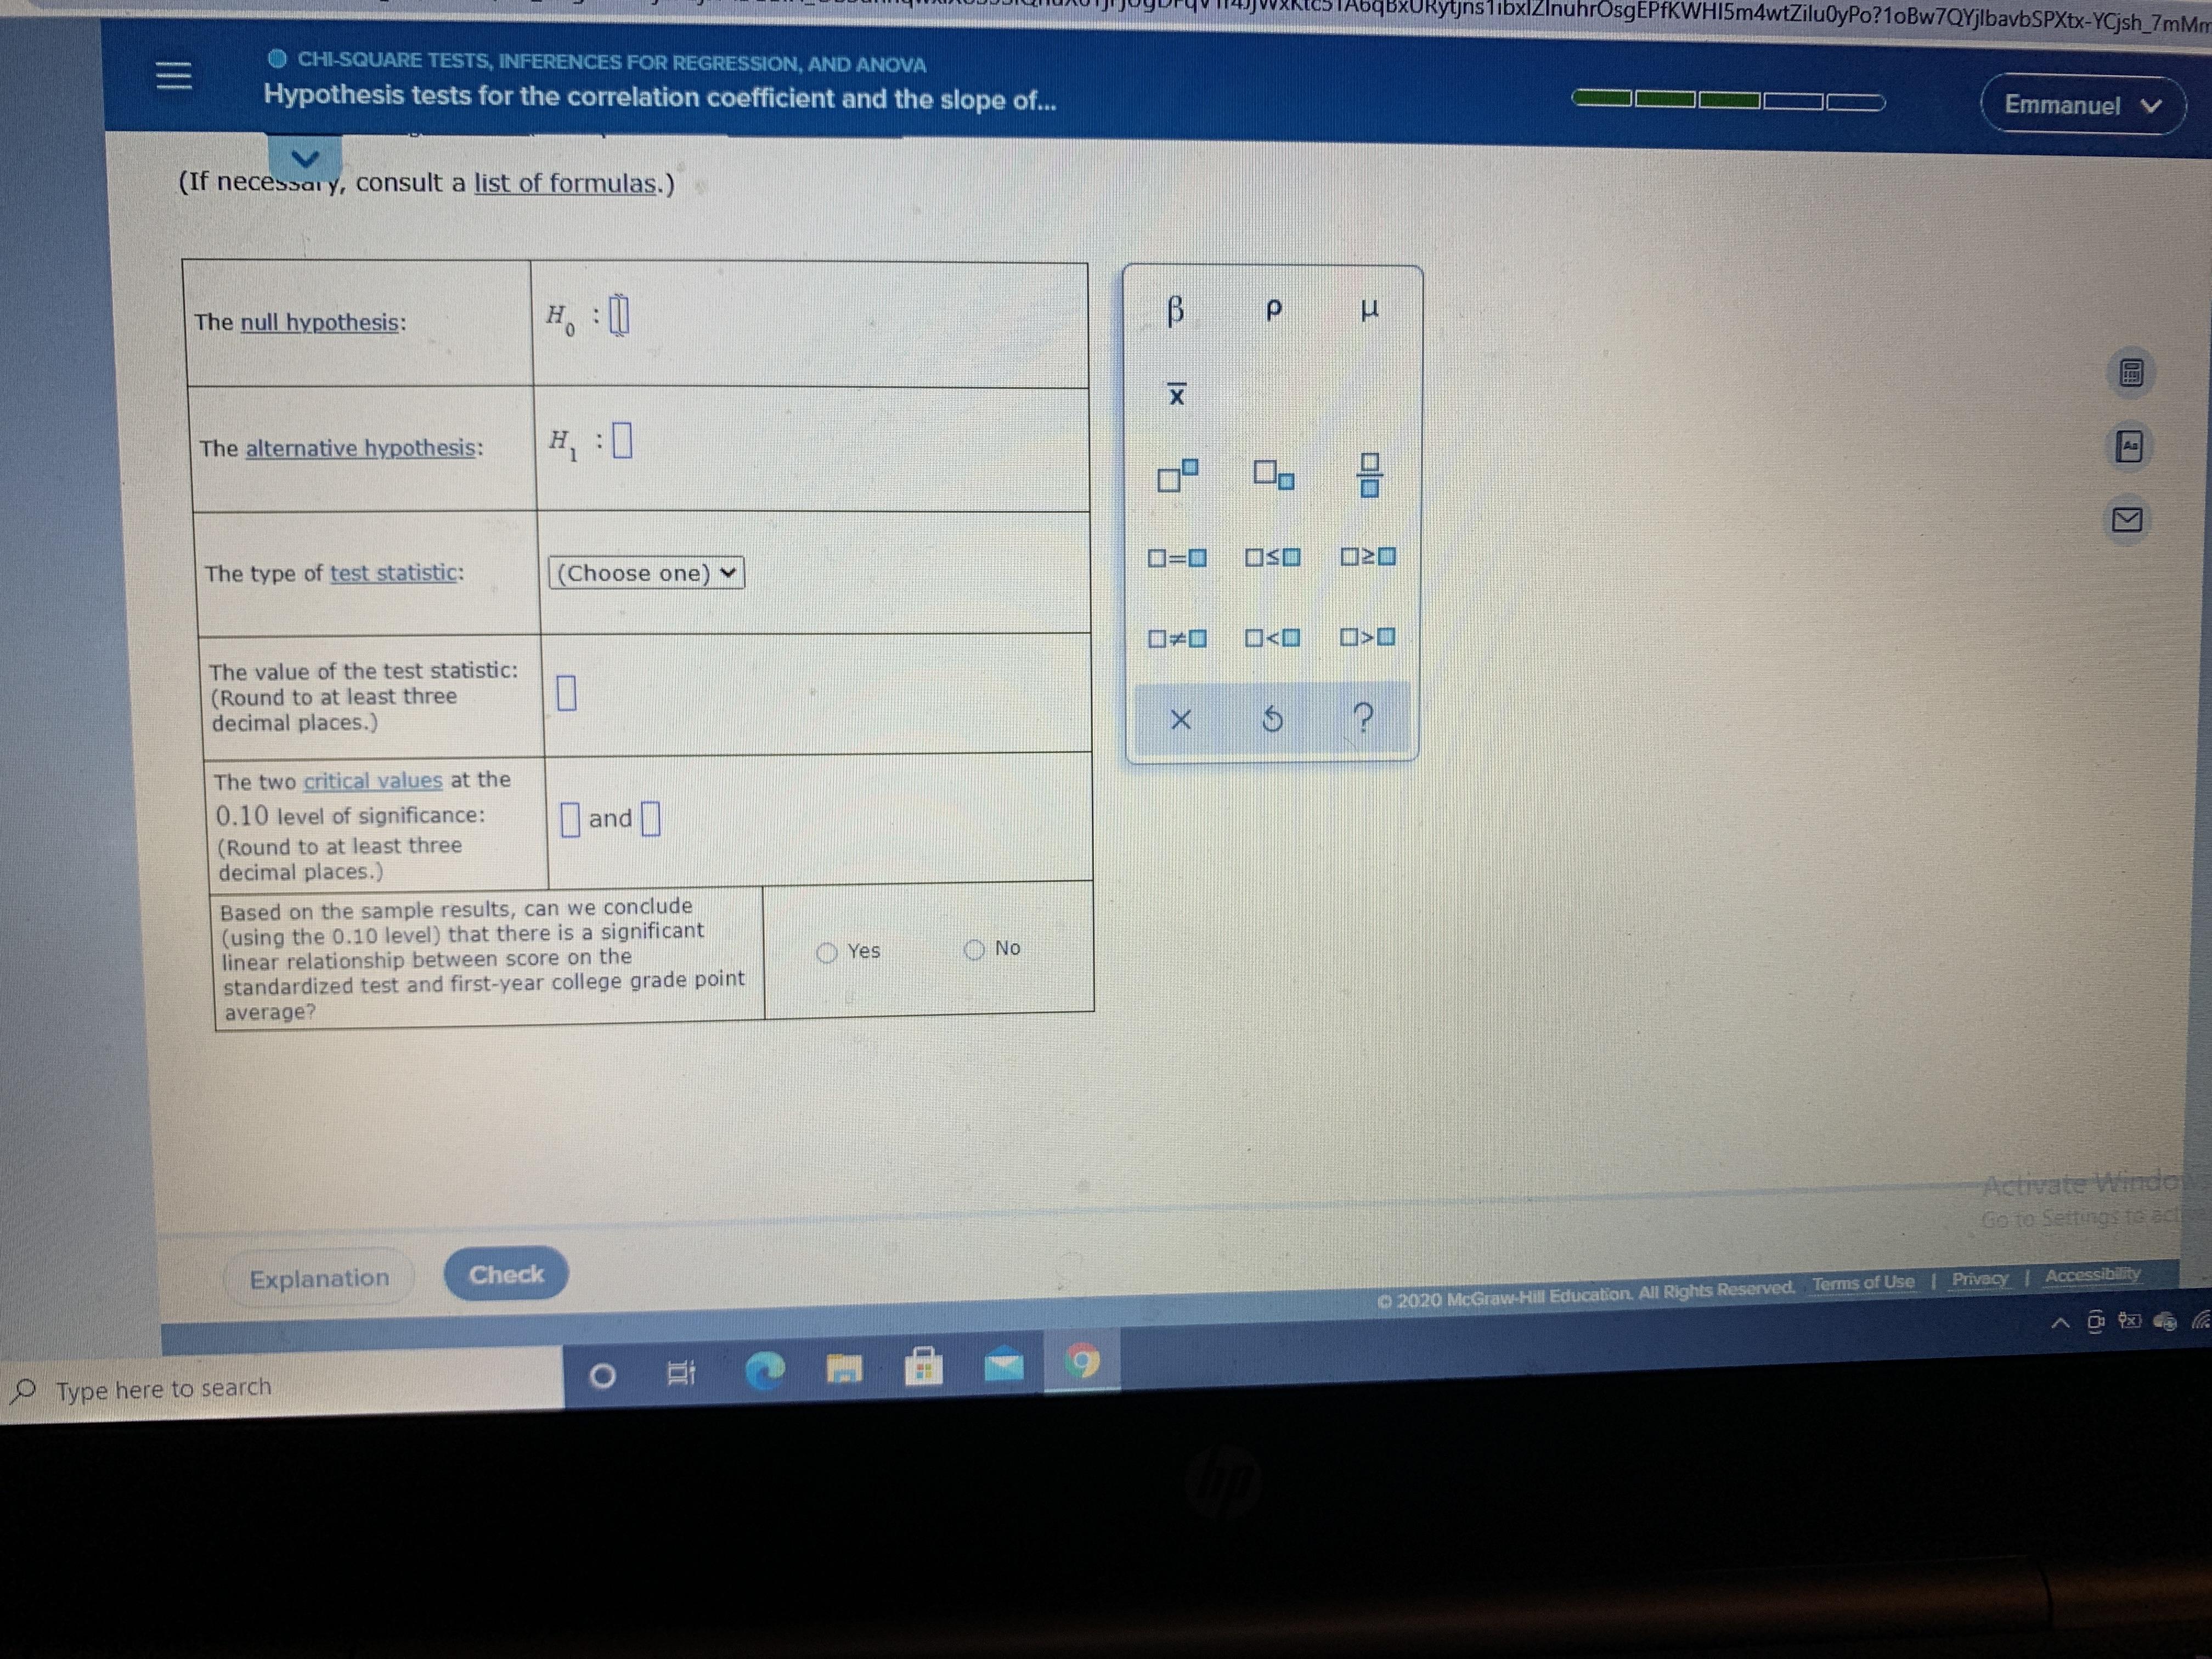
A nationwide standardized test taken by high- school juniors and seniors may or may not measure academic potential, but we can nonetheless examine the relationship between scores on such tests and performance in college. We have chosen a random sample of 102 students just finishing their first year of college, and for each student we've recorded her score on one such standardized test and her grade point average for her first year in college. The sample correlation coefficient r for our data is approximately 0.28. Based on these sample results, test for a significant linear relationship between the two variables score on this standardized test and first-year college grade point average by doing a hypothesis test regarding the population correlation coefficient p. (Assume that the two variables have a bivariate normal distribution.) Use the 0.10 level of significance, and perform a two-tailed test. Then fill in the table below. (If necessary, consult a list of formulas.) The null hypothesis: H, : 0 The altemative hypothesis: OSO The type of test statistic: (Choose one)v The value of the test statistic: (Round to at least three decimal places.) The two critical values at the 0.10 level of significance: (Round to at least three decimal places.) O and ] Astve Based on the sample results, can we conclude tc5TAbqBxURytjnslibxlZlnuhrOsgEPfKWHI5m4wtZilu0yPo?1oBw7QYjlbavbSPXtx-YCjsh_7mMm O CHI-SQUARE TESTS, INFERENCES FOR REGRESSION, AND ANOVA Hypothesis tests for the correlation coefficient and the slope of... Emmanuel V (If necessar y, consult a list of formulas.) The null hypothesis: Ho The alternative hypothesis: H :0 As O=D0 OSO The type of test statistic: (Choose one ロ+ロ O<O The value of the test statistic: (Round to at least three decimal places.) The two critical values at the 0.10 level of significance: |and| (Round to at least three decimal places.) Based on the sample results, can we conclude (using the 0.10 level) that there is a significant linear relationship between score on the standardized test and first-year college grade point average? O Yes O No सि्ड Go to Settings 1e ectioe Explanation Check O2020 McGraw-Hill Education, All Rights Reserved, Terms of Use Privacy Accessibility Type here to search P. B. II A nationwide standardized test taken by high- school juniors and seniors may or may not measure academic potential, but we can nonetheless examine the relationship between scores on such tests and performance in college. We have chosen a random sample of 102 students just finishing their first year of college, and for each student we've recorded her score on one such standardized test and her grade point average for her first year in college. The sample correlation coefficient r for our data is approximately 0.28. Based on these sample results, test for a significant linear relationship between the two variables score on this standardized test and first-year college grade point average by doing a hypothesis test regarding the population correlation coefficient p. (Assume that the two variables have a bivariate normal distribution.) Use the 0.10 level of significance, and perform a two-tailed test. Then fill in the table below. (If necessary, consult a list of formulas.) The null hypothesis: H, : 0 The altemative hypothesis: OSO The type of test statistic: (Choose one)v The value of the test statistic: (Round to at least three decimal places.) The two critical values at the 0.10 level of significance: (Round to at least three decimal places.) O and ] Astve Based on the sample results, can we conclude tc5TAbqBxURytjnslibxlZlnuhrOsgEPfKWHI5m4wtZilu0yPo?1oBw7QYjlbavbSPXtx-YCjsh_7mMm O CHI-SQUARE TESTS, INFERENCES FOR REGRESSION, AND ANOVA Hypothesis tests for the correlation coefficient and the slope of... Emmanuel V (If necessar y, consult a list of formulas.) The null hypothesis: Ho The alternative hypothesis: H :0 As O=D0 OSO The type of test statistic: (Choose one ロ+ロ O<O The value of the test statistic: (Round to at least three decimal places.) The two critical values at the 0.10 level of significance: |and| (Round to at least three decimal places.) Based on the sample results, can we conclude (using the 0.10 level) that there is a significant linear relationship between score on the standardized test and first-year college grade point average? O Yes O No सि्ड Go to Settings 1e ectioe Explanation Check O2020 McGraw-Hill Education, All Rights Reserved, Terms of Use Privacy Accessibility Type here to search P. B. II
Expert Answer:

Related Book For 

Data Analysis and Decision Making
ISBN: 978-0538476126
4th edition
Authors: Christian Albright, Wayne Winston, Christopher Zappe
Posted Date:
Students also viewed these mathematics questions
-
Based on the MTF11SSD, examine the relationship between a teen's race (RACE) and the number of friends who drink alcohol (FRDRINK) and smoke cigarettes (FRSMOKE). Using SPSS Crosstabs, create two...
-
A researcher conducts an experiment to examine the relationship between the weight gain of chickens whose diets had been supplemented by different amounts of the amino acid lysine and the amount of...
-
Use GSS 2010 to examine the relationship between respondents health (HEALTH) and social class (CLASS). Treat social class as the independent variable. a. Request the appropriate measures of...
-
Suppose that in a wave of pessimism, housing prices fall by 10% across the entire economy. a. Has the stock of real assets of the economy changed? b. Are individuals less wealthy? c. Can you...
-
Manually calculate the compound interest on a loan of $6,150 at 1 1 % annual interest compounded annually for three years?
-
Terry Industries produces two electronic decoders, P and Q. Decoder P is more sophisticated and requires more programming and testing than does Decoder Q. Because of these product differences, the...
-
Consider a fictitious dataset of \(n=100\) observations with \(s_{y}=80\). We run a regression with three explanatory variables to get \(s=50\). a. Calculate the adjusted coefficient of...
-
Budgeted selling and administrative expenses for Royal Tire Co. in P7-2 for the year ended December 31, 2013, were as follows: In P7-2, Royal Tire Co.'s budgeted unit sales for the year 2013 were:...
-
2. YA Y F FA 12 C 0=60 X In the figure, XY-coordinate system is the global coordinate System, and xy-coordinate system is the local coordinate system. The force vector at C on truss element is given...
-
B52 Skate Training prepares adjustments annually and showed the following on its June 30, 2020, year-end: Additional information available at year-end: a. The Prepaid Arena Rental of $182,000 was...
-
Company ABC bought an equipment for $20,000 in 2015, with useful life of 5 years $5,000 residual value amortized using straight-line method. Assume ABC has $3,000 income before taxes for each of the...
-
In what ways can you practice listening?
-
How are physical and psychological noise different?
-
How do you see formality observed in your own cultural practices?
-
What are the barriers to listening effectively in teams?
-
Define and give an example of each of Edward T. Halls four spatial zones.
-
After reading through your text and the information by James Hobart (1995) of Classic Systems titled Principles of Good GUI Design, develop your own brief definition of what constitutes good GUI...
-
Jax Incorporated reports the following data for its only product. The company had no beginning finished goods inventory and it uses absorption costing. $ 57.30 per unit $ 10.30 per unit $ 7.80 per...
-
In Example 16.2, the gamma distribution was used to model the skewness to the right of the lifetime distribution. Experiment to see whether the triangular distribution could have been used instead....
-
Find a 95% confidence interval for the proportion of customers who will purchase at least one item if they receive a coupon for 5% off. Repeat for 10% off and for 15% off.
-
Suppose that two dice are tossed. For each die, it is equally likely that 1, 2, 3, 4, 5, or 6 dots will turn up. Let S be the sum of the two dice. a. What is the probability that S will be 5 or 7? b....
-
A balloon is launched at sea level, where the air pressure is \(100 \mathrm{kPa}\). The helium has a volume of \(1000 \mathrm{~m}^{3}\) at this altitude. What is the volume of the helium when the...
-
A balloon is at a height of \(5.0 \mathrm{~km}\) and is descending at a constant rate. The buoyancy force is directed ; the drag force is directed A. Up, up B. Up, down C. Down, up D. Down, down...
-
A balloon is launched at sea level, where the air pressure is \(100 \mathrm{kPa}\). The density in the hot-air chamber is \(1.0 \mathrm{~kg} / \mathrm{m}^{3}\). What is the density of the air when...

Study smarter with the SolutionInn App