

Question: As you can see this is a sample code for gmm algorithm for iris dataset. Give the full code with same implementation of gmm algorithm
As you can see this is a sample code for gmm algorithm for iris dataset. Give the full code with same implementation of gmm algorithm for car evaluation dataset. The implementation and output should be same method as it was given in the images. Both the outputs should be coming and code implementation should also be similar
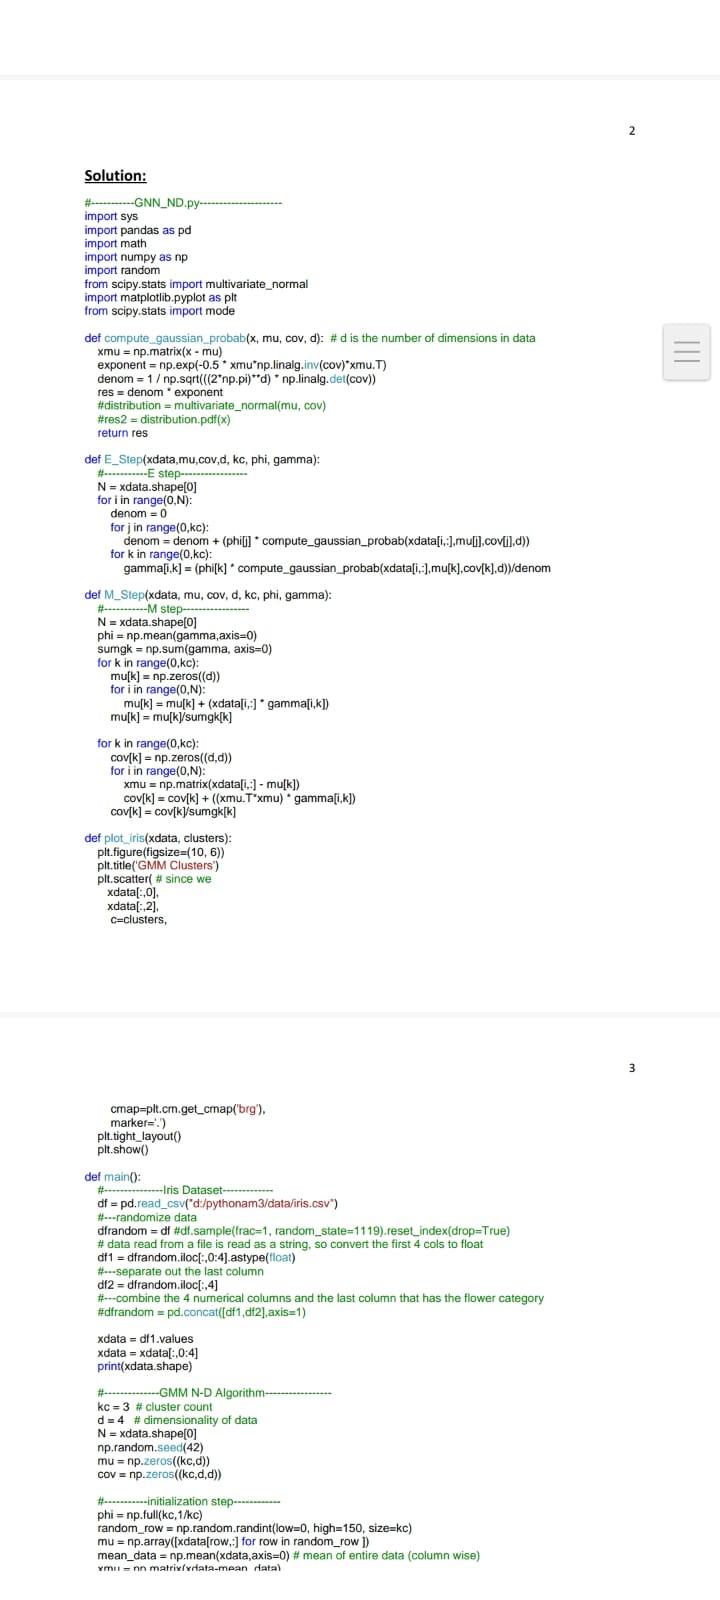
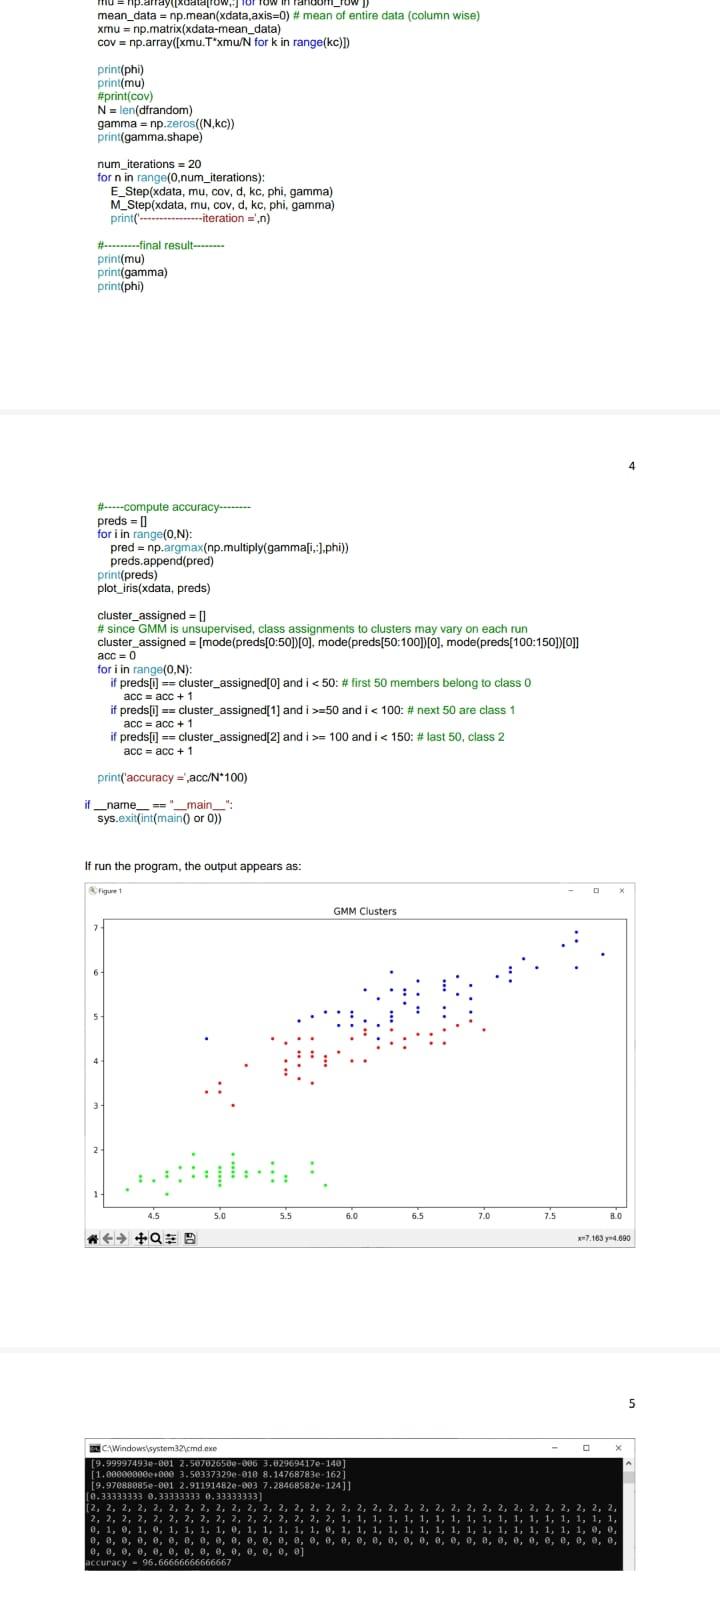
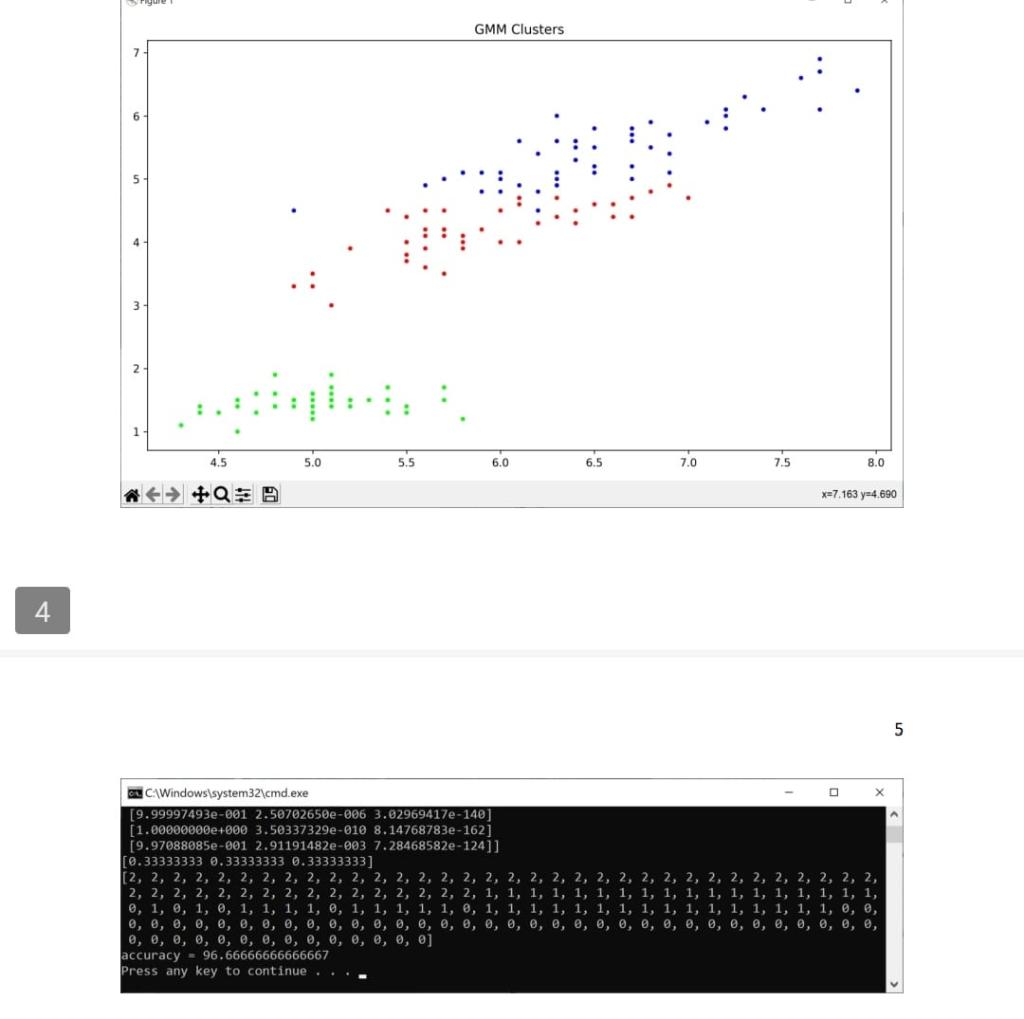
Solution: import sys import pandas as pd import math import numpy as np import random from scipy.stats import multivariate_normal import matplotlib.pyplot as plt from scipy.stats import mode def compute gaussian_probab (x,mu, cov, d): \# d is the number of dimensions in data xmu=np.matrix (xmu) exponent =np.exp(0.5munp.linalg.inv ( cov mu.T) denom =1p.sqr(((2np.pi))d) np.linalg. det(cov)) res = denom " exponent \#distribution = multivariate_normal(mu, cov) \#res2 = distribution.pdf(x) return res def E_Step(xdata,mu,cov,d, kc, phi, gamma): H*.....-E step- N=xdata.shape[0] for i in range(0,N) denom =0 for j in range (0,kc) : denom = denom + (phi[]] compute_gaussian_probab(xdata[i,,],mu[i],cov[i],d)) for k in range (0,kc) : gamma[i,k] = (phi[k] * compute_gaussian_probab (xdata[i,], mu[k],cov[k],d) / denom def M_Slep(xdata, mu, cov, d, kc, phi, gamma): N=xdata shape phi = np.mean (gamma,axis=0) sumgk = np.sum (gamma, axis =0 ) for k in range (0,kc) : mu[k]=np.zeros((d)) for i in range (0,N) : mu[k]=mu[k]+(xdata[i,] gamma[i,k]) for k in range (0,kc) : cov[k]=np.zeros((d,d)) for i in range (0,N) : xmu=np.matrix(xdata[i,j]mu[k]) def plot_iris(xdata, clusters): plt.figure(figsize =(10,6)) plt.title('GMM Clusters') plt.scatter( \# since we x data [:,0], x data [:,2], cmap=plt.crn.get_cmap('brg'), markef =. ') plt.tight_layout() plt.show() def main(): df = pd.read_csv("d/pythonam3/data/iris.csv") H.-randomize data dfrandom = di \#df.sample(trac=1, random_state =1119 ).reset_index(drop=True) \# data read from a file is read as a string, so convert the first 4 cols to float df1 = dfrandom. iloc[: 0:4].astype(tioat) \#--separate out the last column di2 = dfrandom. iloc [,4] \#--combine the 4 numerical columns and the last column that has the flower category \#dfrandom = pd.concat([df1, di2],axis=1). x data = df1 .values x data =xdata[:,0:4] print(xdata.shape) H-...........GMM N-D Algorithm-.............. kC=3 \# cluster count d=4 \# dimensionality of data N=x data.shape[0] np.random.seed(42) mu=np.2cos((kc,d)) cov=npzeros((kc,d,d)) H.......--initialization step-.......... phi =np. full(kc, 1/kc) random_row =np.random. randint ( low =0, high =150, size =kc) mu=np.array ([xdata[row,;] for row in random_row ]) mean_data =np.mean(xdata,axis=0)# mean of entire data (column wise) rmul = nn matrix(ritata-mean iatal 4 H-.--compute accuracy-..... preds =[] for i in range (0,N) : pred =np.argmax(np.multiply ( gamma[i, ],phi)) preds.append(pred) print(preds) plot_iris(xdata, preds) cluster_assigned = [] \# since GMM is unsupervised, class assignments to clusters may vary on each run cluster_assigned =[ mode(preds[0:50]) [0], mode(preds[50:100])[0], mode(preds[100:150])[0]] acc =0 for i in range (0,N) : if preds[i] == cluster_assigned[0] and i=50 and i=100 and i
Step by Step Solution
There are 3 Steps involved in it

Get step-by-step solutions from verified subject matter experts