

Question: This is a sample code for gmm algorithm implemented on iris dataset. I want a similar implementation and similar output on car evaluation dataset. Gmm
 This is a sample code for gmm algorithm implemented on iris dataset. I want a similar implementation and similar output on car evaluation dataset. Gmm algorith for car evaluation dataset should be done with similar implementation as given in the images and also i need to get similar output. Note:text values in the dataset should be converted into numericals.
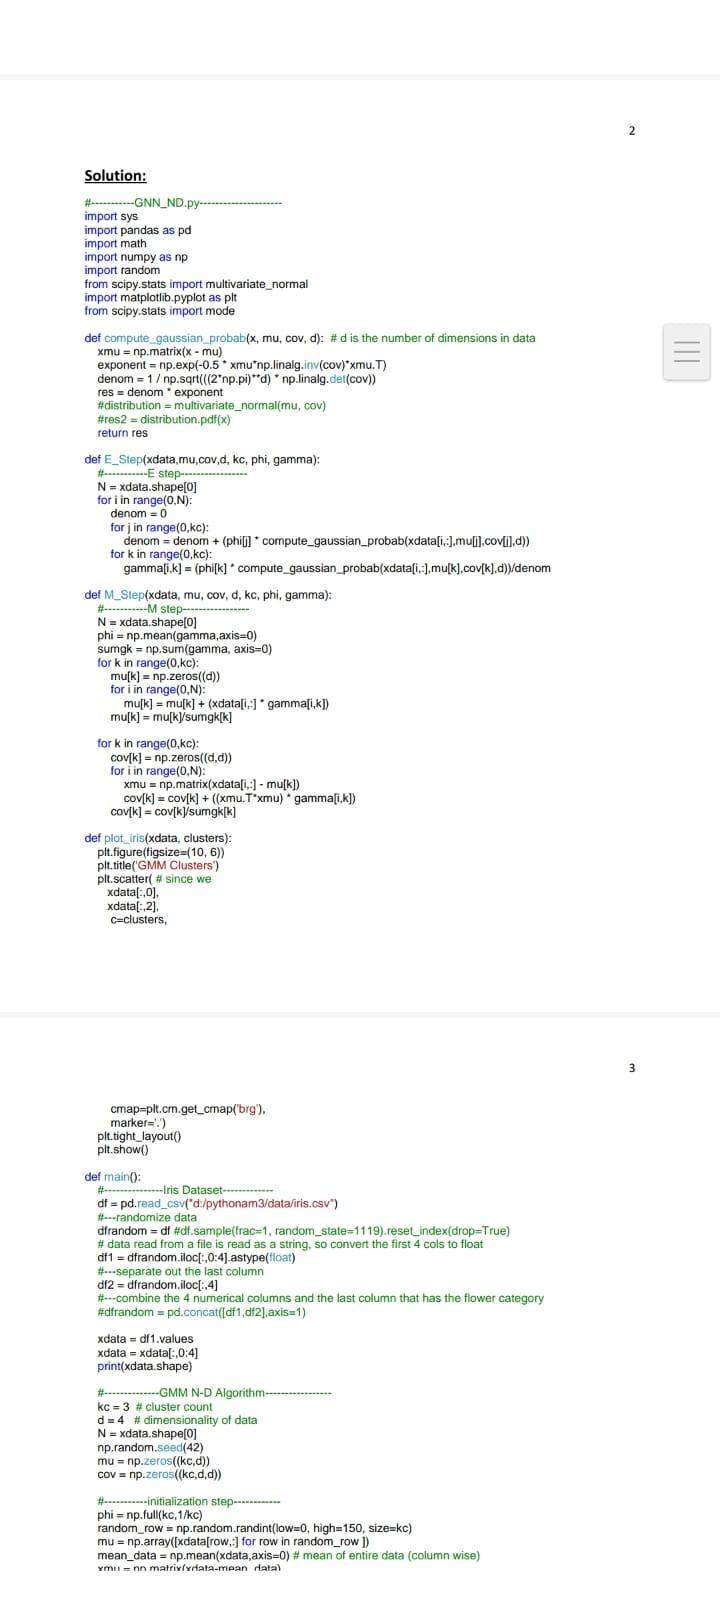
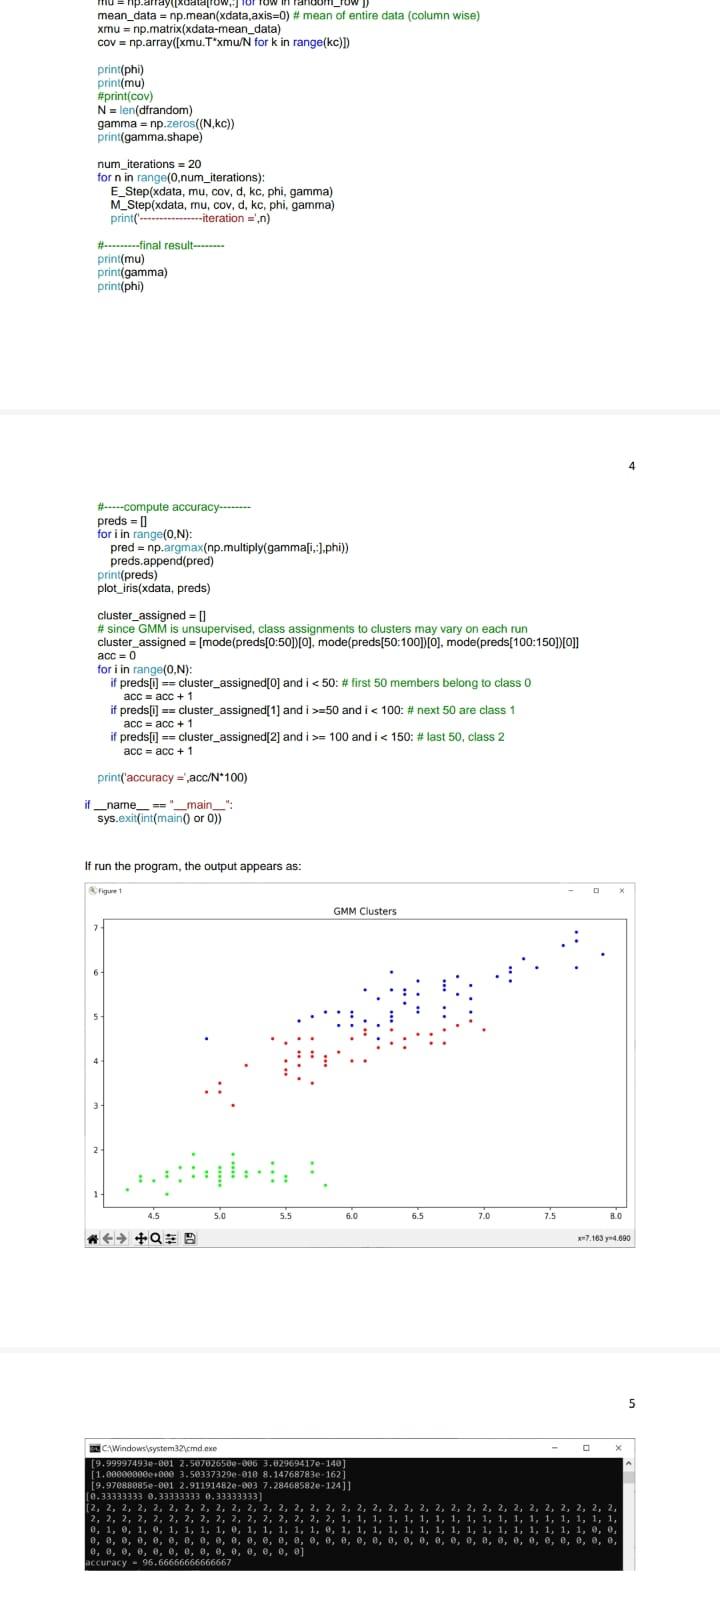
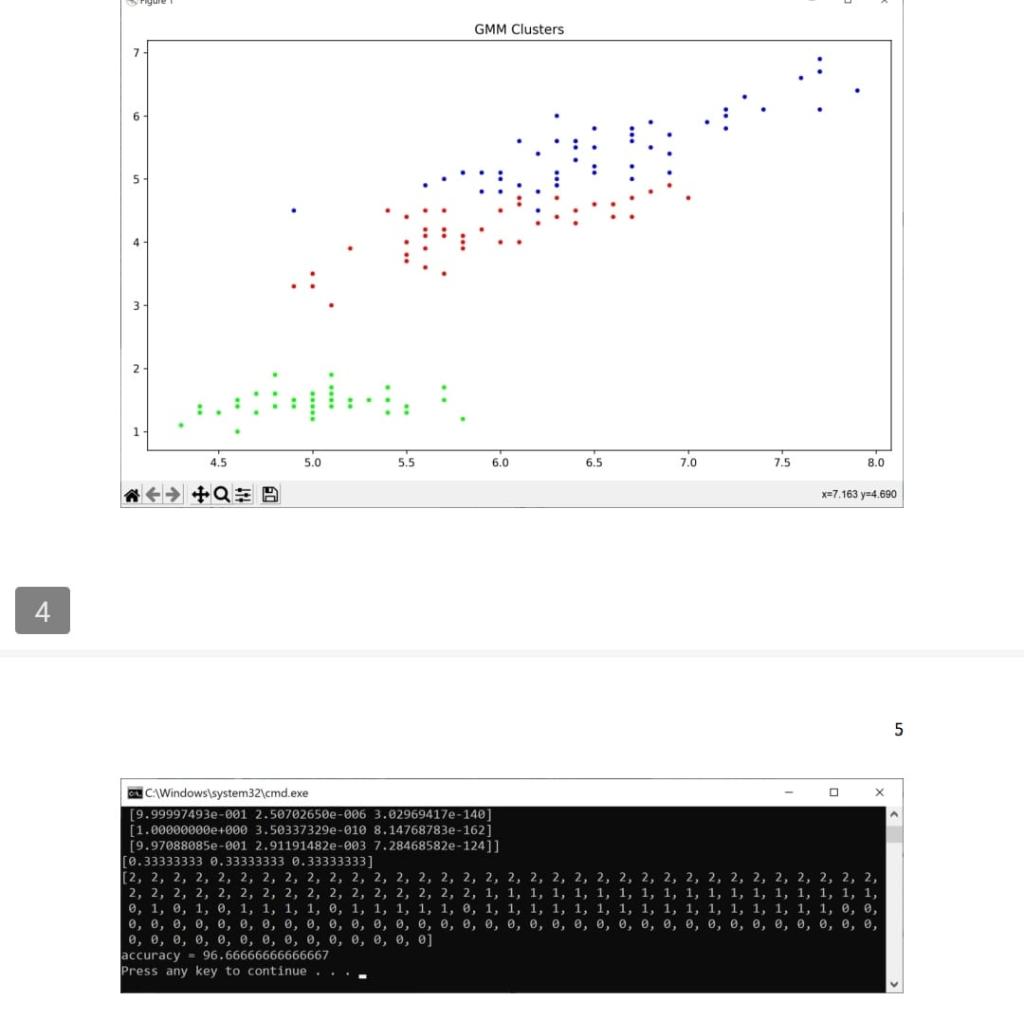
Solution: import sys import pandas as pd import math import numpy as np import random from scipy.stats import multivariate_normal import matplotlib.pyplot as plt from scipy.stats import mode def compute gaussian_probab (x,mu, cov, d): \# d is the number of dimensions in data xmu=np.matrix (xmu) exponent =np.exp(0.5munp.linalg.inv ( cov mu.T) denom =1p.sqr(((2np.pi))d) np.linalg. det(cov)) res = denom " exponent \#distribution = multivariate_normal(mu, cov) \#res2 = distribution.pdf(x) return res def E_Step(xdata,mu,cov,d, kc, phi, gamma): H*.....-E step- N=xdata.shape[0] for i in range(0,N) denom =0 for j in range (0,kc) : denom = denom + (phi[] compute_gaussian_probab(xdata[i,,],mu[i],cov[i],d)) for k in range (0,kc) : gamma[i,k] = (phi[k] * compute_gaussian_probab (xdata[i,], mu[k],cov[k],d) / denom def M_Slep(xdata, mu, cov, d, kc, phi, gamma): N=xdata shape phi = np.mean (gamma,axis=0) sumgk = np.sum (gamma, axis =0 ) for k in range (0,kc) : mu[k]=np.zeros((d)) for i in range (0,N) : mu[k]=mu[k]+(xdata[i,] gamma[i,k]) for k in range (0,kc) : cov[k]=np.zeros((d,d)) for i in range (0,N) : xmu=np.matrix(xdata[i,j]mu[k]) def plot_iris(xdata, clusters): plt.figure(figsize =(10,6)) plt.title('GMM Clusters') plt.scatter( \# since we x data [:,0], x data [:,2], cmap=plt.crn.get_cmap('brg'), markef =. ') plt.tight_layout() plt.show() def main(): df = pd.read_csv("d/pythonam3/data/iris.csv") H.-randomize data dfrandom = di \#df.sample(trac=1, random_state =1119 ).reset_index(drop=True) \# data read from a file is read as a string, so convert the first 4 cols to float df1 = dfrandom. iloc[: 0:4].astype(tioat) \#--separate out the last column di2 = dfrandom. iloc [,4] \#--combine the 4 numerical columns and the last column that has the flower category \#dfrandom = pd.concat([df1, di2],axis=1). x data = df1 .values x data =xdata[:,0:4] print(xdata.shape) H-...........GMM N-D Algorithm-.............. kC=3 \# cluster count d=4 \# dimensionality of data N=x data.shape[0] np.random.seed(42) mu=np.2cos((kc,d)) cov=npzeros((kc,d,d)) H.......--initialization step-.......... phi =np. full(kc, 1/kc) random_row =np.random. randint ( low =0, high =150, size =kc) mu=np.array ([xdata[row,;] for row in random_row ]) mean_data =np.mean(xdata,axis=0)# mean of entire data (column wise) rmul = nn matrix(ritata-mean iatal 4 H-.--compute accuracy-..... preds =[] for i in range (0,N) : pred =np.argmax(np.multiply ( gamma[i, ],phi) ) preds.append(pred) print(preds) plot_iris(xdata, preds) cluster_assigned = [] \# since GMM is unsupervised, class assignments to clusters may vary on each run cluster_assigned =[ mode(preds[0:50]) [0], mode(preds[50:100])[0], mode(preds[100:150])[0]] acc =0 for i in range (0,N) : if preds[i] == cluster_assigned[0] and i=50 and i=100 and i
Step by Step Solution
There are 3 Steps involved in it

Get step-by-step solutions from verified subject matter experts