

Question: ASAP Please X Take a Test - Lachlan Mckenzie - Google Chrome mathxl.com/Student/PlayerTest.aspx?testld=215680800¢erwin=yes COMM121 Lachlan Mckenzie & | 21/05/20 2:31 PM Test: Quiz 2 -
ASAP Please
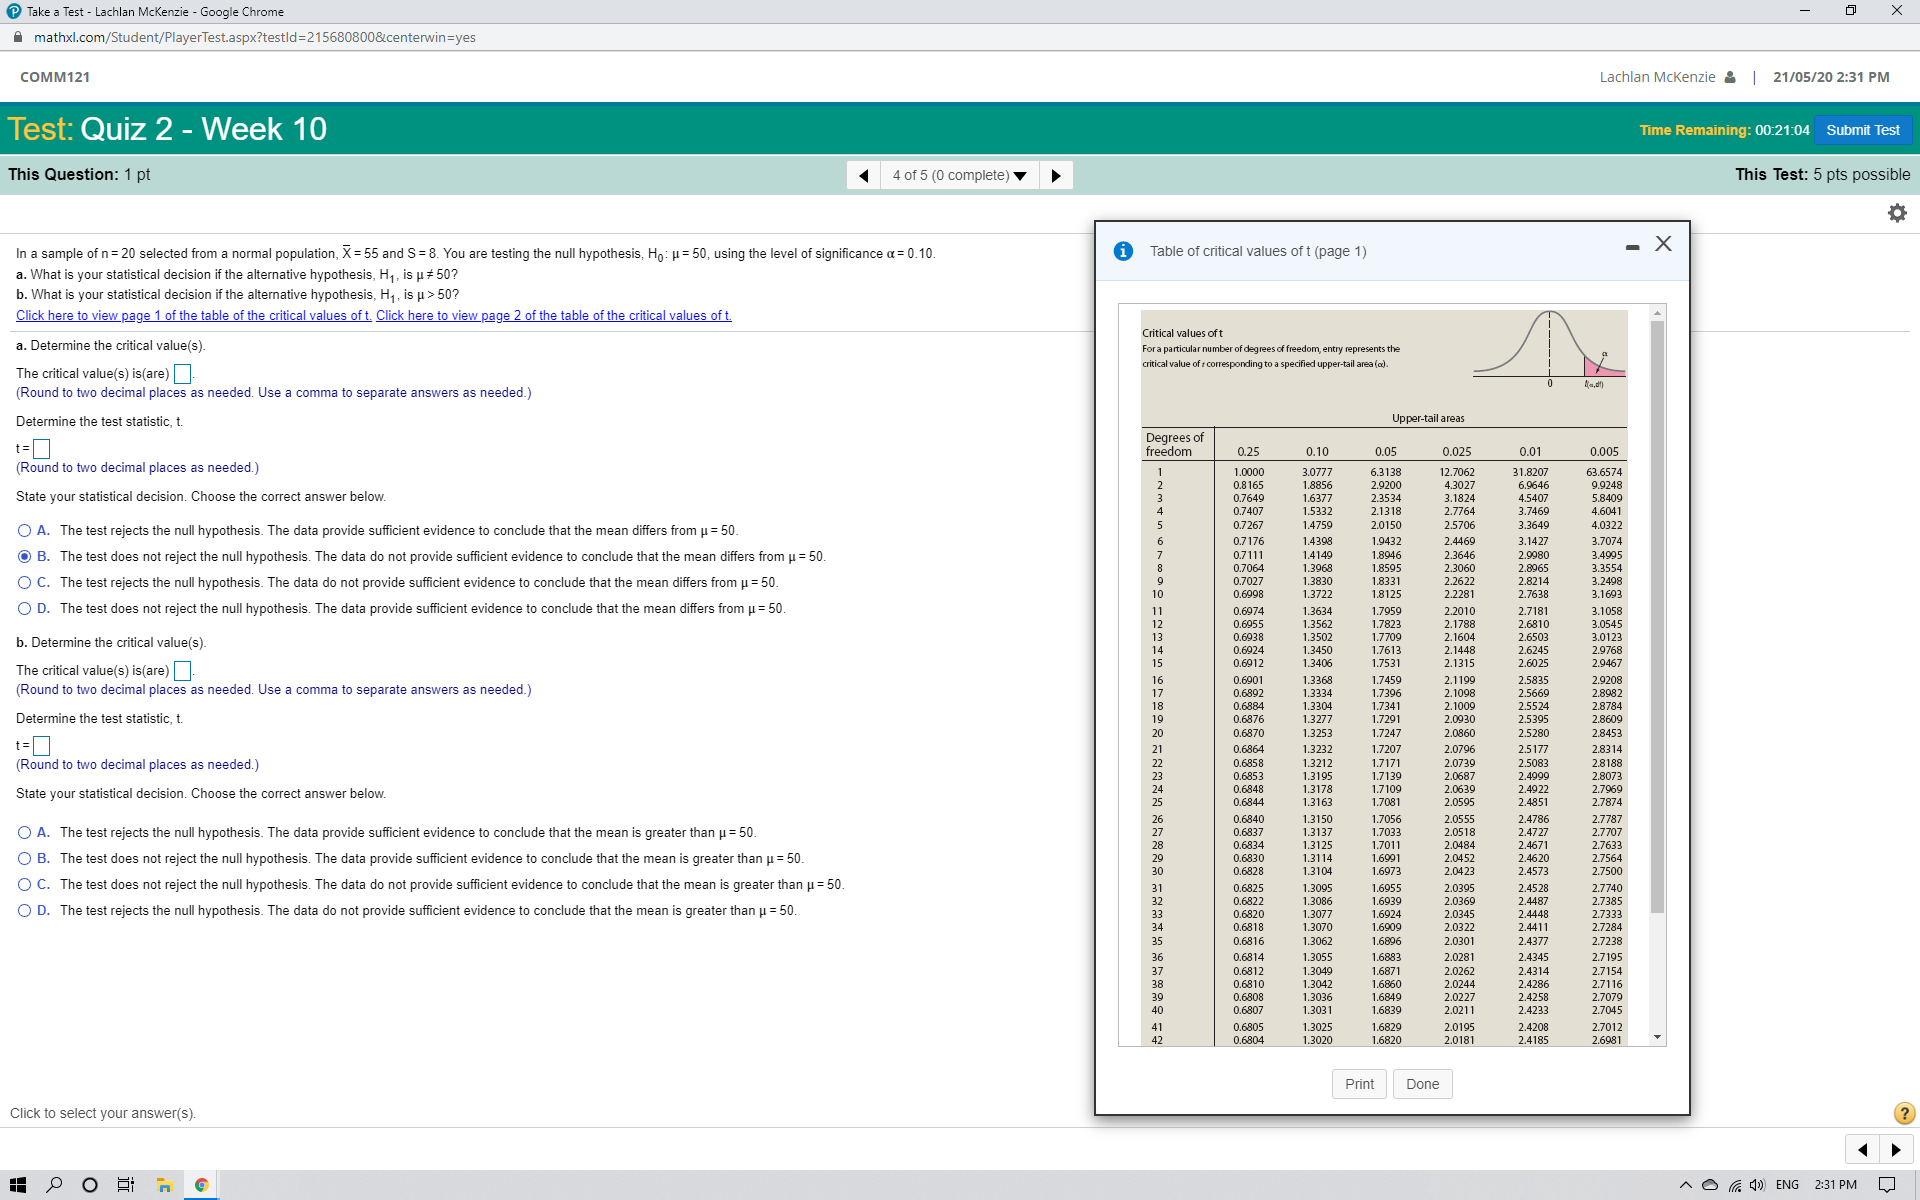
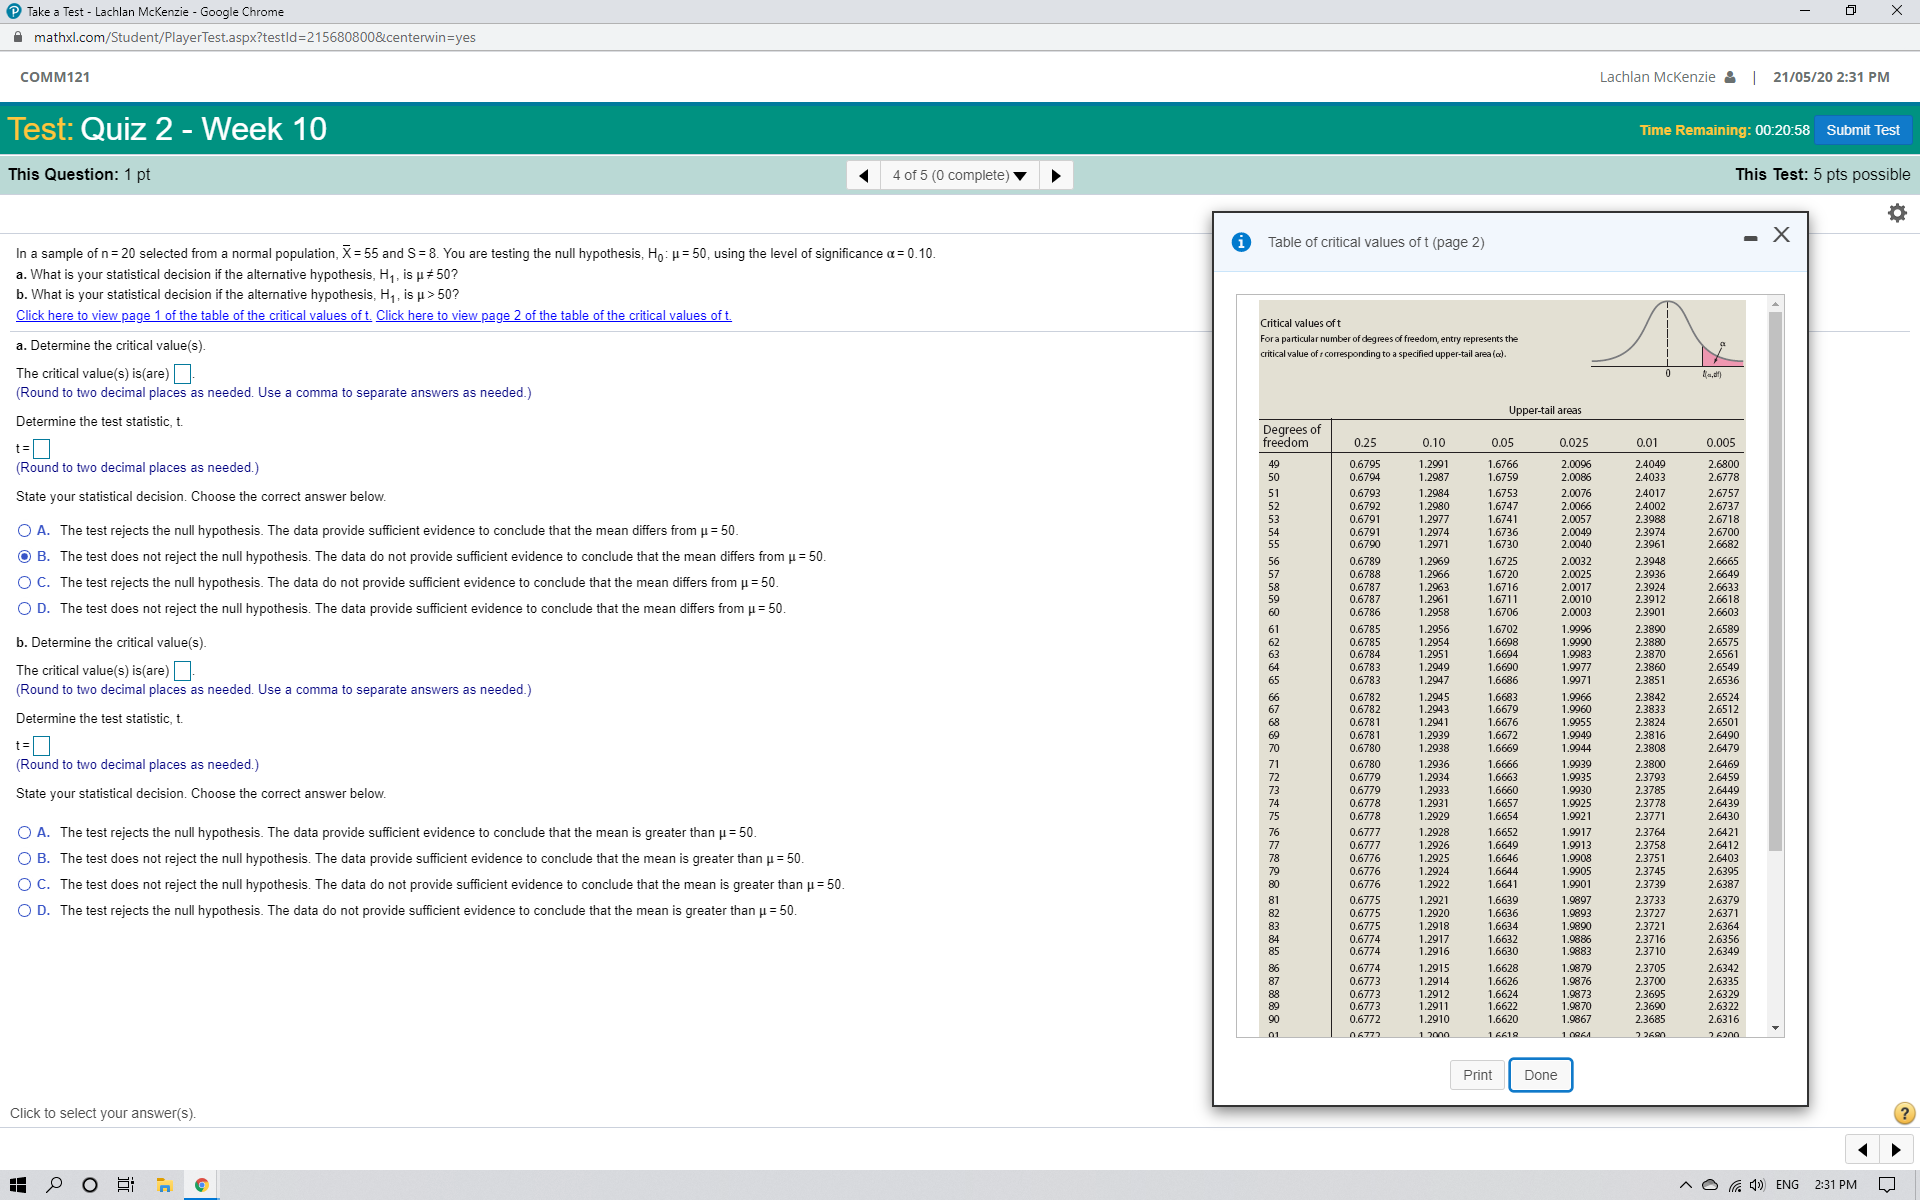
X Take a Test - Lachlan Mckenzie - Google Chrome mathxl.com/Student/PlayerTest.aspx?testld=215680800¢erwin=yes COMM121 Lachlan Mckenzie & | 21/05/20 2:31 PM Test: Quiz 2 - Week 10 Time Remaining: 00:21:04 Submit Test This Question: 1 pt 1 4 of 5 (0 complete) This Test: 5 pts possible Table of critical values of t (page 1) - X In a sample of n = 20 selected from a normal population, X = 55 and S = 8. You are testing the null hypothesis, Ho: u = 50, using the level of significance a = 0.10. a. What is your statistical decision if the alternative hypothesis, H,, is u # 50? b. What is your statistical decision if the alternative hypothesis, H, , is u > 50? Click here to view page 1 of the table of the critical values of t. Click here to view page 2 of the table of the critical values of t. Critical values oft a. Determine the critical value(s) For a particular number of degrees of freedom, entry represents the critical value of r corresponding to a specified upper-tail area (a). The critical value(s) is(are). (Round to two decimal places as needed. Use a comma to separate answers as needed.) Upper-tail areas Determine the test statistic, Degrees of t= freedom 0.25 0.10 0.05 0.025 0.01 0.005 (Round to two decimal places as needed.) 1.0000 3.0777 63.6574 0.8 165 5.3138 12.7062 2.9200 4.3027 31.8207 6.9646 State your statistical decision. Choose the correct answer below. 1.6377 3.1824 4.5407 9,9248 0.7649 5.8409 0.7407 1.5332 2.3534 2.1318 3.7469 4.6041 1.4759 2.0150 2.7764 2.5706 3.3649 4.0322 O A. The test rejects the null hypothesis. The data provide sufficient evidence to conclude that the mean differs from u = 50. 0.7267 0.717 1.4398 1.9432 2.4469 3.1427 3.7074 O B. The test does not reject the null hypothesis. The data do not provide sufficient evidence to conclude that the mean differs from u = 50. 0.7111 1.894 2.3646 2.9980 3.4095 0.7064 1.8595 2.3060 2.8965 3.3554 0.7027 3.2408 O C. The test rejects the null hypothesis. The data do not provide sufficient evidence to conclude that the mean differs from u = 50 18331 2.2627 2.8214 0.6998 1.3722 1.8125 2.2281 2.7638 3.1693 O D. The test does not reject the null hypothesis. The data provide sufficient evidence to conclude that the mean differs from u = 50. 0.6974 1.3634 1.7959 2.2010 2.7181 3.1058 0.6955 1.3562 1.7823 2.178 2.6810 3.0545 0.6938 1.3502 1.7709 2.6503 3.0123 b. Determine the critical value(s). 0.6924 1.3450 1.7613 2.160 2.144 2.9768 0.6912 1.3406 1.7531 2.1315 2.6025 2.9467 The critical value(s) is(are) 0.6901 1.3368 1.745 2.1199 2.5835 2.9208 (Round to two decimal places as needed. Use a comma to separate answers as needed.) 0.6892 1.3334 1.7396 2.5669 1.3304 2.1098 1.7341 2.1009 2.5524 2.8982 2.8784 1.7201 2.0930 Determine the test statistic, t. 0.6876 1.3277 2.5395 2.8609 0.6870 1.3253 1,7247 2.0860 2.5280 2.8453 t= 0.6864 1.3232 1.7207 2.0796 2.8314 1.3212 1.7171 2.0739 2.5083 2.8188 (Round to two decimal places as needed.) 0. 6858 0.6853 0.6848 1.3195 1.7139 2.0687 2.4999 1.7109 2.0639 2.8073 1.3178 2.4922 2.7969 State your statistical decision. Choose the correct answer below. 0.6844 1.3163 1.7081 2.0595 2.4851 2.7874 0.6840 1.3150 1.7056 2.0555 2 4786 O A. The test rejects the null hypothesis. The data provide sufficient evidence to conclude that the mean is greater than u = 50. 0.6837 0.6834 1.3137 1.7033 2.0518 2.4727 2.7707 1.3125 1 701 1 3 0484 O B. The test does not reject the null hypothesis. The data provide sufficient evidence to conclude that the mean is greater than u = 50. 0.6830 1.3114 1.6001 20452 2.4620 27564 0.6828 1.3104 .6973 2.0423 2.4573 2.7500 O C. The test does not reject the null hypothesis. The data do not provide sufficient evidence to conclude that the mean is greater than u = 50. 0. 6825 1.6955 2.039 2.4528 2.7740 0.6822 1.3086 1.6939 2.036 2.4487 2.7385 O D. The test rejects the null hypothesis. The data do not provide sufficient evidence to conclude that the mean is greater than u = 50 0.6820 1.3077 1.6924 1.5009 2.0345 2.4448 2.4411 EEELZ 0.6818 1.3070 2.0322 2.7284 0.6816 .6896 2.0301 2.4377 2.7238 0.6814 1.3062 1.3055 1.6883 2.0281 2.4345 2.7195 0.6812 1.3049 .6871 2.0262 2.4314 2.7154 0.6810 1.3042 1.6860 2.0244 2.4286 2.7116 0.6808 1.3036 1.6849 2.0227 2.4258 2.7079 0.6807 1.3031 .6839 2.0211 2.4233 2.7045 0.6805 1.3025 1.6829 2.0195 2.4208 2.7012 0.6804 1.3020 1.6820 2.0181 2.4185 2.6981 Print Done Click to select your answer(s). HOOEmo ~ 0 (7 41) ENG 2:31 PMTake a Test - Lachlan Mckenzie - Google Chrome X mathxl.com/Student/PlayerTest.aspx?testld=215680800¢erwin=yes COMM121 Lachlan Mckenzie & | 21/05/20 2:31 PM Test: Quiz 2 - Week 10 Time Remaining: 00:20:58 Submit Test This Question: 1 pt 1 4 of 5 (0 complete) This Test: 5 pts possible In a sample of n = 20 selected from a normal population, X = 55 and S = 8. You are testing the null hypothesis, Ho: H = 50, using the level of significance a = 0. 10. i Table of critical values of t (page 2) - X a. What is your statistical decision if the alternative hypothesis, H,, is u # 50? b. What is your statistical decision if the alternative hypothesis, H, , is u > 50? Click here to view page 1 of the table of the critical values of t. Click here to view page 2 of the table of the critical values of t. Critical values of t a. Determine the critical value(s) For a particular number of degrees of freedom, entry represents the ritical value of r corresponding to a specified upper-tail area (c). The critical value(s) is(are). (Round to two decimal places as needed. Use a comma to separate answers as needed.) Determine the test statistic, Upper-tail areas Degrees of t= freedom 0.25 0.10 0.05 0.025 0.01 0.005 (Round to two decimal places as needed.) 49 0.6795 1.2991 1.6766 2.0096 2.4049 2.6800 0.6794 1.2987 1.6759 2.0086 2.4033 2.6778 State your statistical decision. Choose the correct answer below. 0.6793 1.6753 0.6792 2.0076 2.4017 2.6757 1.298 1.6747 O A. The test rejects the null hypothesis. The data provide sufficient evidence to conclude that the mean differs from u = 50. 0.6791 .2977 1.6741 2.0066 0.6791 1.6736 2.0057 2.4002 2.3988 2.6737 2.6718 O B. The test does not reject the null hypothesis. The data do not provide sufficient evidence to conclude that the mean differs from u = 50. 0.6790 .2974 1 6730 2.0049 2.0040 2.3974 2.3961 0.6789 .2969 2.6665 O C. The test rejects the null hypothesis. The data do not provide sufficient evidence to conclude that the mean differs from u = 50 0.6788 1.6725 2.0032 2.3948 1.2966 1.6720 2.0025 0.6787 2.3936 2.6649 1.296 1.6716 2.0017 2.3924 O D. The test does not reject the null hypothesis. The data provide sufficient evidence to conclude that the mean differs from u = 50. 0.6787 0.6786 1.2961 1.6711 1.2958 2.0010 2.391 2.6618 1.6706 2.0003 2.3901 2.6603 b. Determine the critical value(s). 0.6785 1.2956 1.6702 1.9996 2.6589 0.6785 2.389 0.678 1.9990 1.9983 2.3880 2.6561 The critical value(s) is(are) 0.6783 1.6690 1.9977 2.386 2.6549 (Round to two decimal places as needed. Use a comma to separate answers as needed.) 0.6783 1.9971 2.3851 2.6536 0.6782 .2945 1.6683 1.9966 2.6524 Determine the test statistic, t. 1.2943 2.3842 0.6782 1.9960 2.3833 2.6512 0.678 1.2941 2.3824 2.6501 0.6781 1.2939 1.9955 t= 1.9949 2.6490 6780 1.2938 6669 .9944 2.3816 2.3808 2.6479 (Round to two decimal places as needed.) 0.6780 1.2936 1.6666 1.9939 0.6779 17034 2.380 2.6469 1.9935 2.3793 2.6459 State your statistical decision. Choose the correct answer below. 0.6779 1.2933 1.6660 1.9930 2.3785 2.6449 0.6778 1.9925 0.6778 2.3771 2.6439 1.2929 1.6654 1.9921 2.6430 O A. The test rejects the null hypothesis. The data provide sufficient evidence to conclude that the mean is greater than u = 50. 0.6777 1.2928 1.6652 1.9917 1.2926 2.3764 2.6421 6412 O B. The test does not reject the null hypothesis. The data provide sufficient evidence to conclude that the mean is greater than u = 50. 0.6777 0.6776 1.9913 2.3758 .3751 1 2024 1.6644 3745 2.6403 O C. The test does not reject the null hypothesis. The data do not provide sufficient evidence to conclude that the mean is greater than u = 50. 0.6776 2.6395 0.6776 1.2922 1.6641 1.9901 2.3739 2.6387 O D. The test rejects the null hypothesis. The data do not provide sufficient evidence to conclude that the mean is greater than u = 50 0.6775 1.2921 1.6639 2.6379 0.6775 .3733 1.2920 1.6636 1.9893 2.3727 0.6775 1 6634 2.6371 .2918 0.6774 2.3721 1.2917 138 16 1.6632 0.6774 1.6630 1.0683 2.3716 2.6364 2.6356 2.3710 2.6349 0.6774 .2915 1.6628 1.9879 2.3705 2.6342 0.6773 1.6626 1.9876 2.3700 2.6335 0.6773 1.2914 1.2912 1.6624 1.9873 0.6773 1.2911 12010 1.6622 1.9870 2.3695 2.3690 2.6329 2.6322 0.6772 1.6620 1.9867 2.3685 2.6316 06773 1 2000 2 6200 Print Done Click to select your answer(s). HOOEmo ~ 0 (7 1)) ENG 2:31 PM
Step by Step Solution
There are 3 Steps involved in it

Get step-by-step solutions from verified subject matter experts