

Question: asks the user to specify the input file, asks the user to specify the output file, makes a plot of the fraction of the total
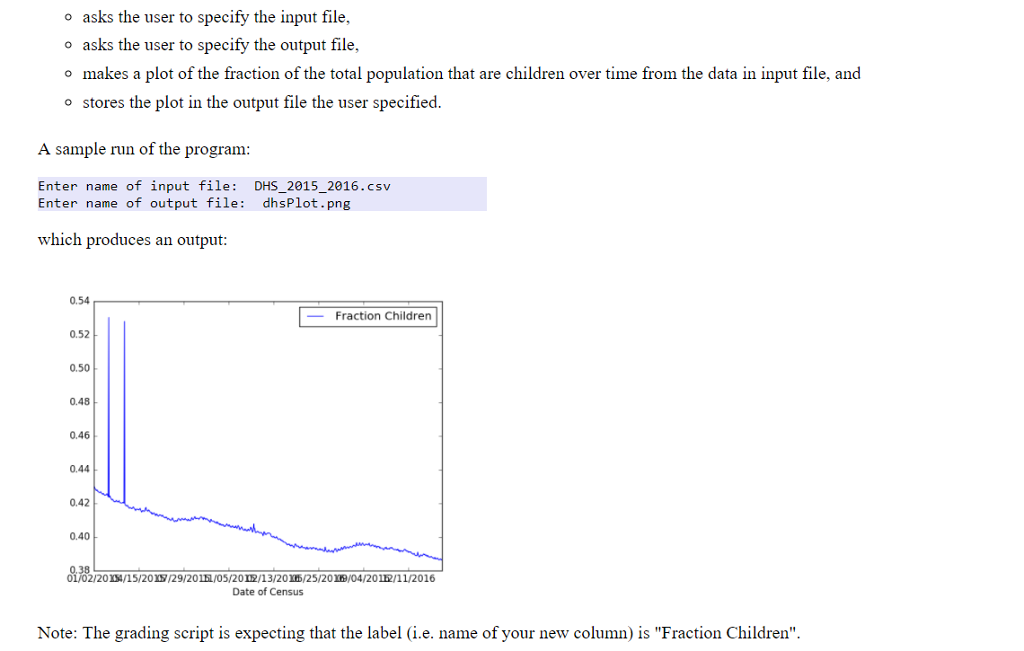
asks the user to specify the input file, asks the user to specify the output file, makes a plot of the fraction of the total population that are children over time from the data in input file, and stores the plot in the output file the user specified. A sample run of the program: Enter name of input file: DHS_2015_2016.csv Enter name of output file: dhsPlot.png which produces an output: 0.54 Fraction Children 052 0.5 0.48 0.46 .44 042 0.40 /2ors4/15/2ory/29/20m/05/2012/13/2015125/2019/04/2012/11/2016 Date of Census Note: The grading script is expecting that the label (i.e. name of your new column) is "Fraction Children
Step by Step Solution
There are 3 Steps involved in it
1 Expert Approved Answer
Step: 1 Unlock

Question Has Been Solved by an Expert!
Get step-by-step solutions from verified subject matter experts
Step: 2 Unlock
Step: 3 Unlock