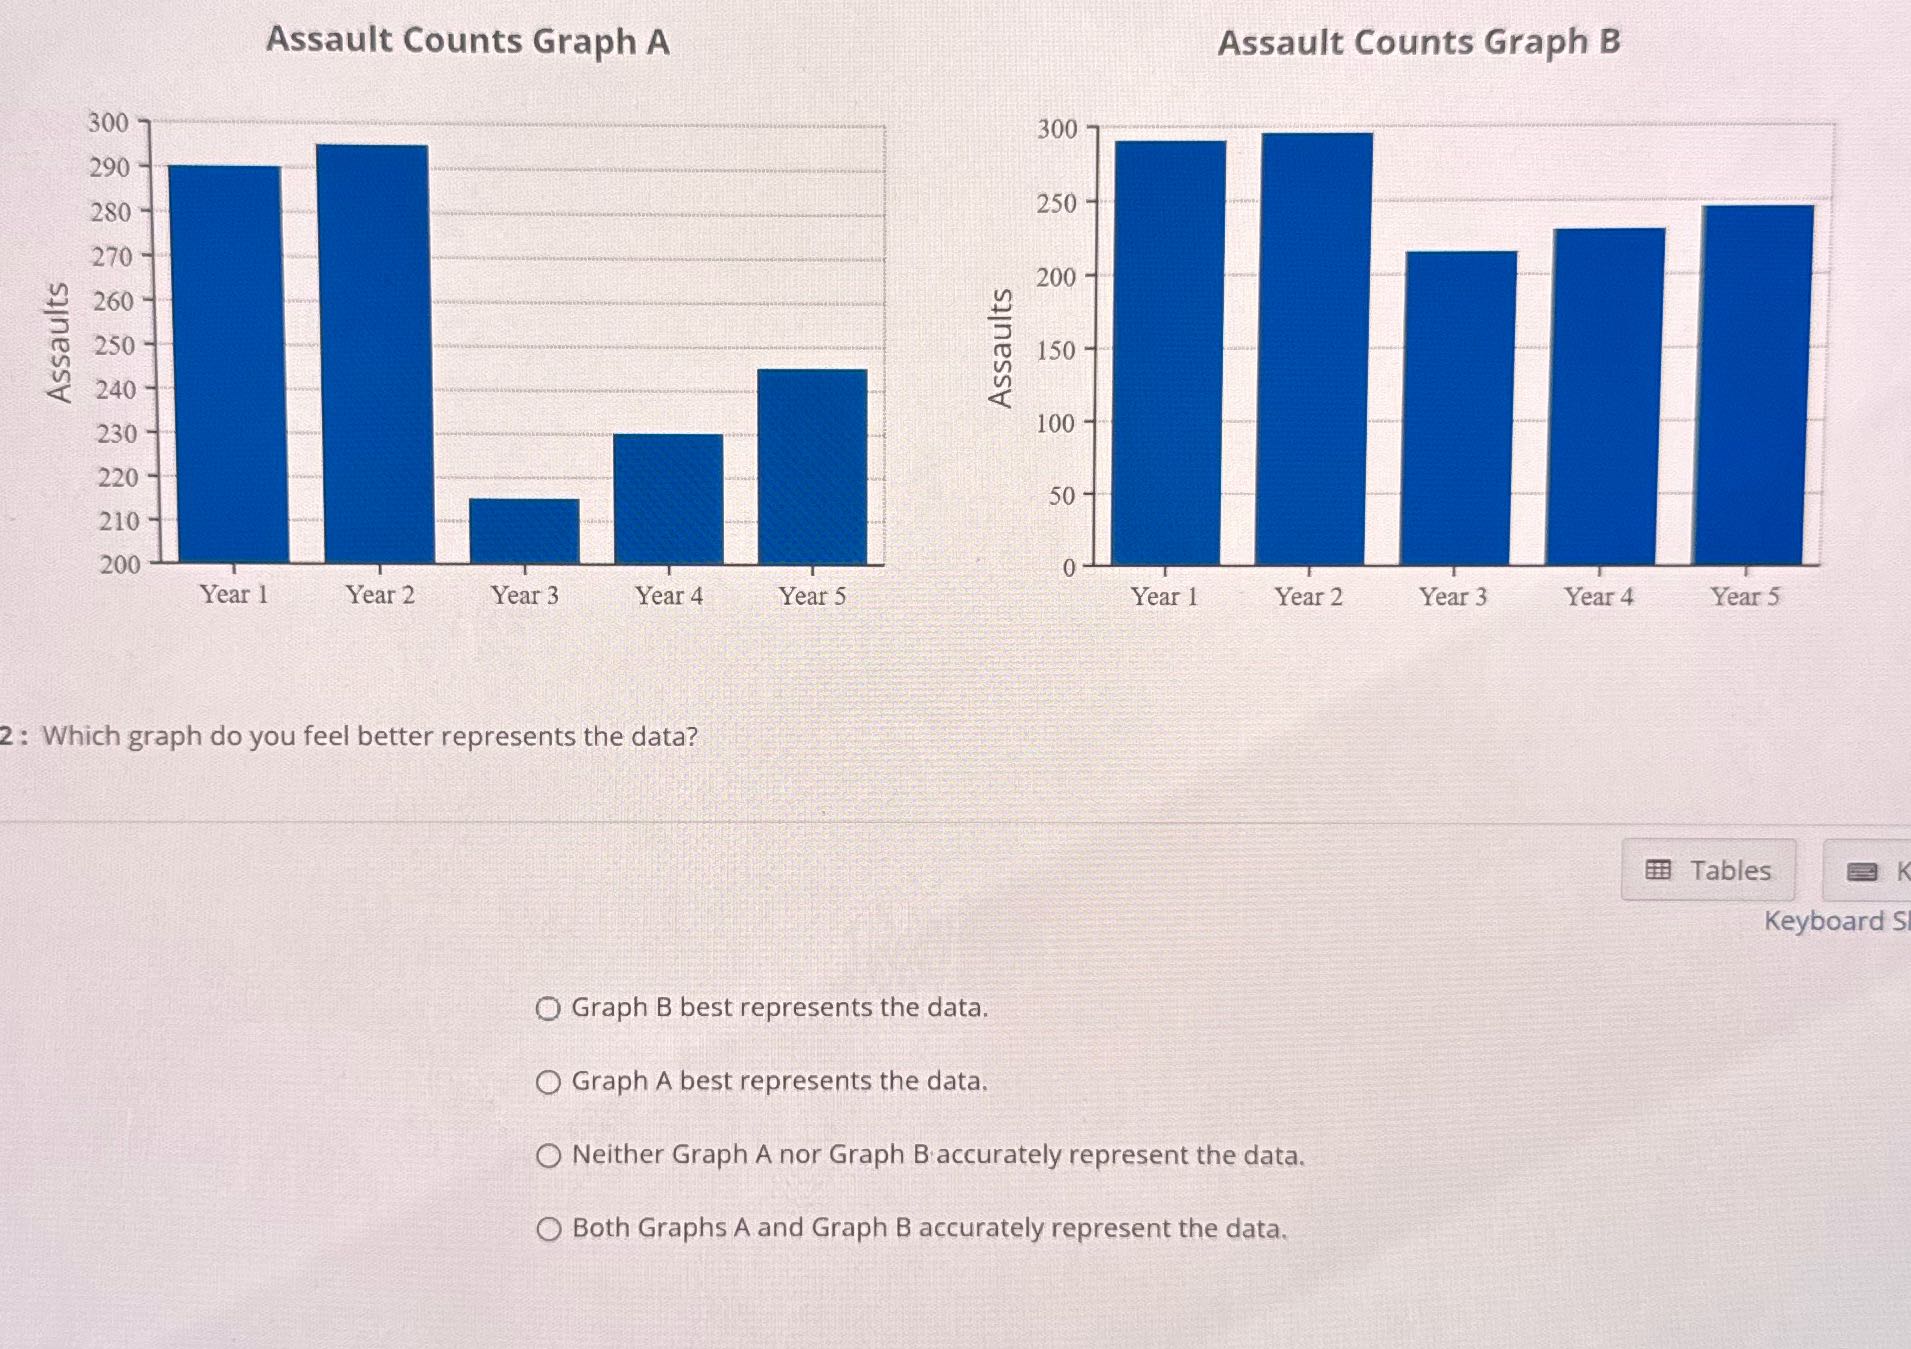
Question: Assault Counts Graph A Assault Counts Graph B 300 300 290 280 250 - 270 200 - 260 Assaults 250 - Assaults 150 - 240

Assault Counts Graph A Assault Counts Graph B 300
Assault Counts Graph A Assault Counts Graph B 300 300 290 280 250 - 270 200 - 260 Assaults 250 - Assaults 150 - 240 - 230 - 100 220 50 210 200 Year 1 Year 2 Year 3 Year 4 Year 5 Year 1 Year 2 Year 3 Year 4 Year 5 2 : Which graph do you feel better represents the data? Tables Keyboard S O Graph B best represents the data. O Graph A best represents the data. O Neither Graph A nor Graph B accurately represent the data. Both Graphs A and Graph B accurately represent the data

Step by Step Solution

There are 3 Steps involved in it

1 Expert Approved Answer
Step: 1 Unlock blur-text-image
Question Has Been Solved by an Expert!

Get step-by-step solutions from verified subject matter experts

Step: 2 Unlock
Step: 3 Unlock

Students Have Also Explored These Related Accounting Questions!