

Question: Assessment 2 Directions: Given the data below, compute the indicated statistics. Follow the instructions in your learner guide. Show your solutions. 1. As of August
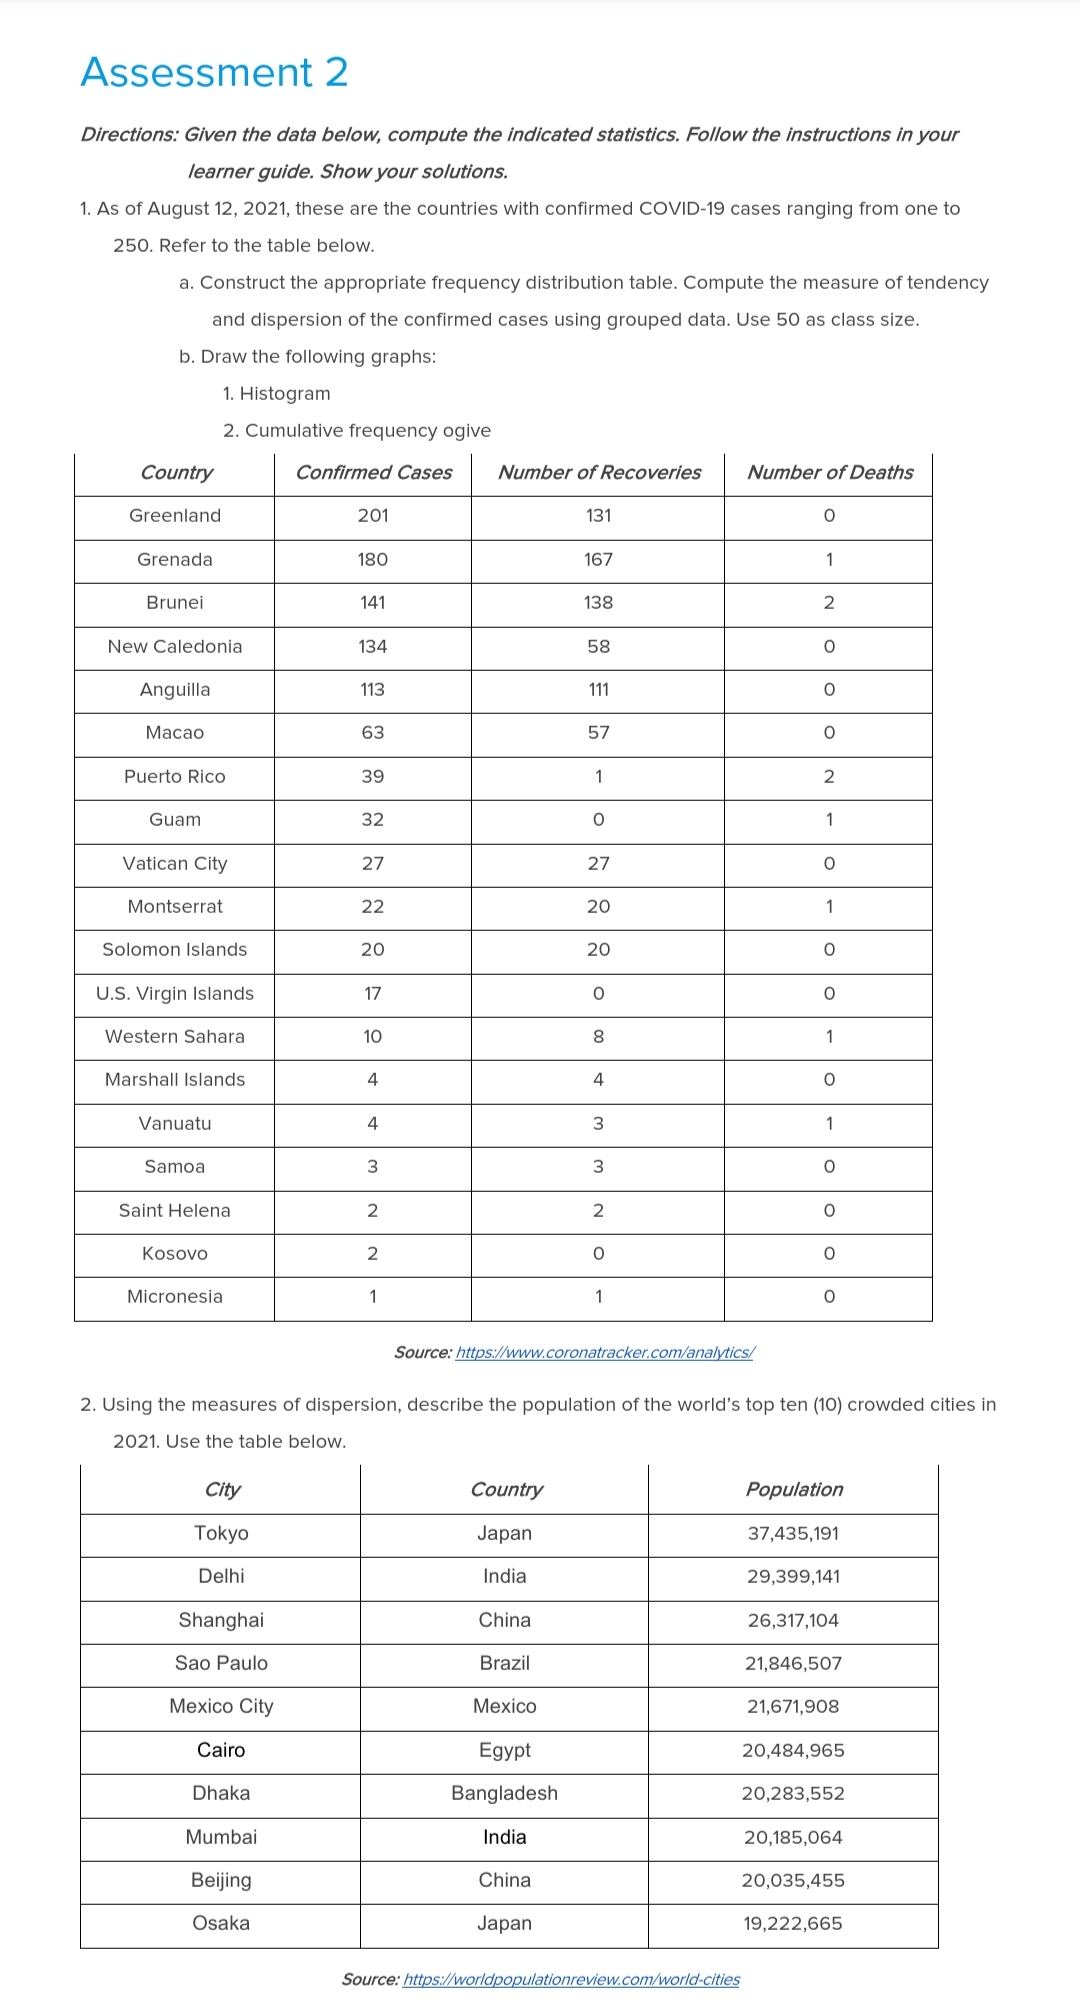
Assessment 2 Directions: Given the data below, compute the indicated statistics. Follow the instructions in your learner guide. Show your solutions. 1. As of August 12, 2021, these are the countries with confirmed COVID-19 cases ranging from one to 250. Refer to the table below. a. Construct the appropriate frequency distribution table. Compute the measure of tendency and dispersion of the confirmed cases using grouped data. Use 50 as class size. b. Draw the following graphs: 1. Histogram 2. Cumulative frequency ogive Country Confirmed Cases Number of Recoveries Number of Deaths Greenland 201 131 O Grenada 180 167 - Brunei 141 138 2 New Caledonia 134 58 0 Anguilla 113 111 0 Macao 63 57 0 Puerto Rico 39 1 N Guam 32 - Vatican City 27 27 0 Montserrat 22 20 Solomon Islands 20 20 0 U.S. Virgin Islands 17 O 0 Western Sahara 10 8 - Marshall Islands 4 4 O Vanuatu 4 W Samoa 3 3 0 Saint Helena 2 2 O Kosovo 2 0 Micronesia 1 Source: https://www.coronatracker.com/analytics/ 2. Using the measures of dispersion, describe the population of the world's top ten (10) crowded cities in 2021. Use the table below. City Country Population Tokyo Japan 37,435,191 Delhi India 29,399,141 Shanghai China 26,317,104 Sao Paulo Brazil 21,846,507 Mexico City Mexico 21,671,908 Cairo Egypt 20,484,965 Dhaka Bangladesh 20,283,552 Mumbai India 20,185,064 Beijing China 20,035,455 Osaka Japan 19,222,665 Source: https://worldpopulationreview.com/world-cities
Step by Step Solution
There are 3 Steps involved in it

Get step-by-step solutions from verified subject matter experts