

Question: Assignment 1 - Chapter 3 Using the Wait Time Excel Spread Sheet - Wait Time - Chapter 3.xlsx Find the sample mean on the outputs.
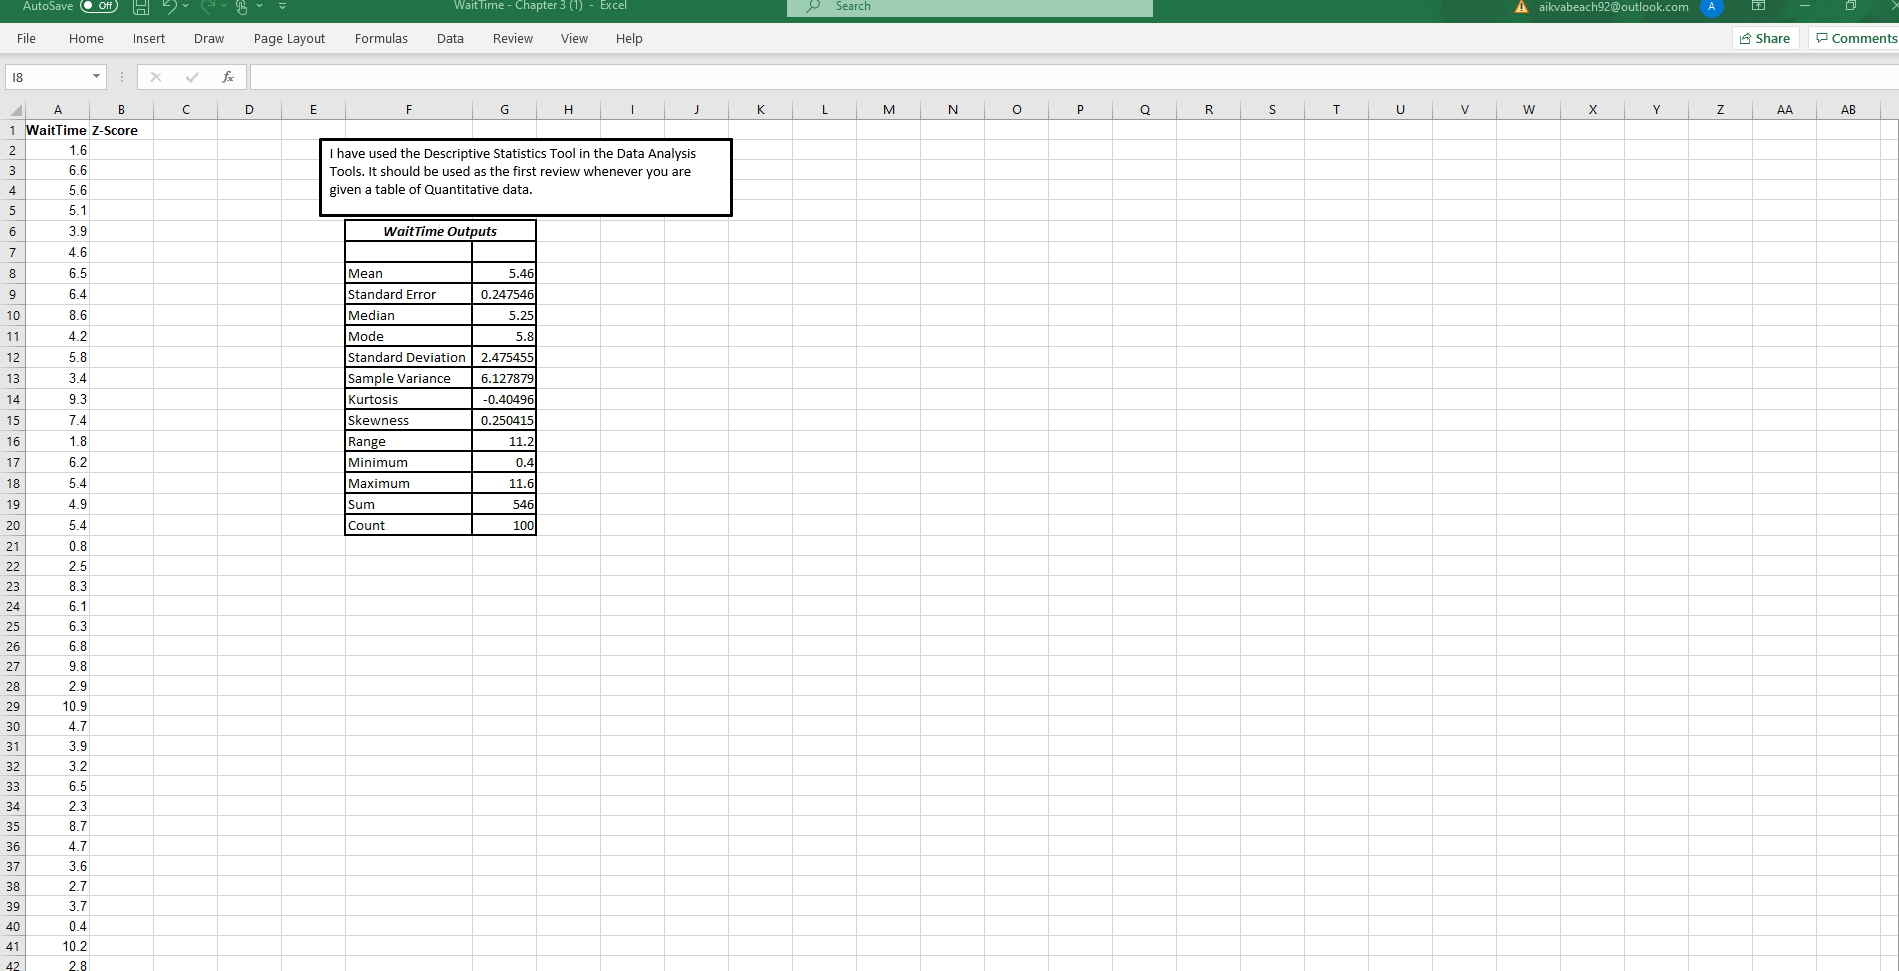
Assignment 1 - Chapter 3 Using the Wait Time Excel Spread Sheet - Wait Time - Chapter 3.xlsx Find the sample mean on the outputs. Does the sample mean provide some evidence that the mean of the population of all possible customer waiting times during peak business hours is less than six minutes (as is desired by the bank manager)? Explain your answer. 1. Find the sample mean and median. How do the mean and median compare? 2. Create a Histogram: How does the histogram support your answer in number 2? If using MegaStat do not input the Interval width or the lower boundary. MegaStat will compute these and is often good for the first pass. 3. Find the Z-Score for each of the Wait Times. You can use the Excel Function STANDARDIZE(x, mean, standard dev) or set up the Z-score equation in excel. Are all the values within 99.73% or three standard deviations from the mean? AutoSave Off H v = Wait Time - Chapter 3 (1) - Excel Search A akvabeach92@outlook.com - File Home Insert Draw Page Layout Formulas Data Review View Help Share Comments 18 x fc C D G H I J K L M N O P Q R S T U V W X Y Z AA AB A B 1 Wait Time Z-Score 1.6 6.6 I have used the Descriptive Statistics Tool in the Data Analysis Tools. It should be used as the first review whenever you are given a table of Quantitative data. 5.6 5.1 3.9 Wait Time Outputs 5.46 0.247546 6.4 8.6 4.2 5.25 5.8 5.8 9.3 Mean Standard Error Median Mode Standard Deviation Sample Variance Kurtosis Skewness Range Minimum Maximum Sum Count 2.475455 6.127879 -0.40496 0.250415 11.2 0.41 11.6 546 100 4.9 5.4 0.8 2.5 8.3 6.1 6.3 6.8 9.8 2.9 10.9 4.7 3.9 3.2 6.5 2.3 8.7 4.7 3.6 2.7 3.7 0.4 10.2 2.8 AutoSave Of H b flv B- Wait Time - Chapter 3 (1) - Excel Search A aikvabeach92@outlook.com A - File Home Insert Draw Page Layout Formulas Data Review View Help Share A B C D E F G H I J I L M N O P Q R S T U V W X r i AA 7.7 4.0 1.4 7.8 5.2 8.4 6.3 4.4 5.2 7.4 6.1 3.8 10.7 7.5 7.0 5.3 4.5 4.5 1.8 3.7 4.0 5.7 2.4 9.2 5.0 7.2 7.3 4.1 6.7 3.5 6.3 4.3 3.8 5.1 5.5 UILE CHdplers - Excel Search File Home Insert Draw P age Layout A aikvabeach 92@outlook.com A - Formulas Data Review View Help 0 Commen Share B C D E F G H I JK J L M N O P Q I U V W X Y Z AA AB I A 0.4 10.2 2.8 11.6 4.3 3.1 5.8 5.6 4.4 4.5 6.7 4.3 2.2 5.8 8.6 2.0 8.0 9.5 1.3 4.8 9.9 7.9 1.1 7.2 9.1 7.7 4.0 1.4 7.8 5.2 8.4 6.3 4.4 52 76 7.4 6.1 3.8 10.7 7.5 7.0 5.3 Assignment 1 - Chapter 3 Using the Wait Time Excel Spread Sheet - Wait Time - Chapter 3.xlsx Find the sample mean on the outputs. Does the sample mean provide some evidence that the mean of the population of all possible customer waiting times during peak business hours is less than six minutes (as is desired by the bank manager)? Explain your answer. 1. Find the sample mean and median. How do the mean and median compare? 2. Create a Histogram: How does the histogram support your answer in number 2? If using MegaStat do not input the Interval width or the lower boundary. MegaStat will compute these and is often good for the first pass. 3. Find the Z-Score for each of the Wait Times. You can use the Excel Function STANDARDIZE(x, mean, standard dev) or set up the Z-score equation in excel. Are all the values within 99.73% or three standard deviations from the mean? AutoSave Off H v = Wait Time - Chapter 3 (1) - Excel Search A akvabeach92@outlook.com - File Home Insert Draw Page Layout Formulas Data Review View Help Share Comments 18 x fc C D G H I J K L M N O P Q R S T U V W X Y Z AA AB A B 1 Wait Time Z-Score 1.6 6.6 I have used the Descriptive Statistics Tool in the Data Analysis Tools. It should be used as the first review whenever you are given a table of Quantitative data. 5.6 5.1 3.9 Wait Time Outputs 5.46 0.247546 6.4 8.6 4.2 5.25 5.8 5.8 9.3 Mean Standard Error Median Mode Standard Deviation Sample Variance Kurtosis Skewness Range Minimum Maximum Sum Count 2.475455 6.127879 -0.40496 0.250415 11.2 0.41 11.6 546 100 4.9 5.4 0.8 2.5 8.3 6.1 6.3 6.8 9.8 2.9 10.9 4.7 3.9 3.2 6.5 2.3 8.7 4.7 3.6 2.7 3.7 0.4 10.2 2.8 AutoSave Of H b flv B- Wait Time - Chapter 3 (1) - Excel Search A aikvabeach92@outlook.com A - File Home Insert Draw Page Layout Formulas Data Review View Help Share A B C D E F G H I J I L M N O P Q R S T U V W X r i AA 7.7 4.0 1.4 7.8 5.2 8.4 6.3 4.4 5.2 7.4 6.1 3.8 10.7 7.5 7.0 5.3 4.5 4.5 1.8 3.7 4.0 5.7 2.4 9.2 5.0 7.2 7.3 4.1 6.7 3.5 6.3 4.3 3.8 5.1 5.5 UILE CHdplers - Excel Search File Home Insert Draw P age Layout A aikvabeach 92@outlook.com A - Formulas Data Review View Help 0 Commen Share B C D E F G H I JK J L M N O P Q I U V W X Y Z AA AB I A 0.4 10.2 2.8 11.6 4.3 3.1 5.8 5.6 4.4 4.5 6.7 4.3 2.2 5.8 8.6 2.0 8.0 9.5 1.3 4.8 9.9 7.9 1.1 7.2 9.1 7.7 4.0 1.4 7.8 5.2 8.4 6.3 4.4 52 76 7.4 6.1 3.8 10.7 7.5 7.0 5.3
Step by Step Solution
There are 3 Steps involved in it

Get step-by-step solutions from verified subject matter experts