

Question: Assignment 1 is simply solving modification of problem 7 on page 195 in the textbook. I want the answer in file as Rmarkdown (A1_your_name.Rmd) and
Assignment 1 is simply solving modification of problem 7 on page 195 in the textbook.
I want the answer in file as Rmarkdown (A1_your_name.Rmd) and html (A1_your_name.html) files
Upload both the html (produced by knitting the Rmd file) and the Rmd files!
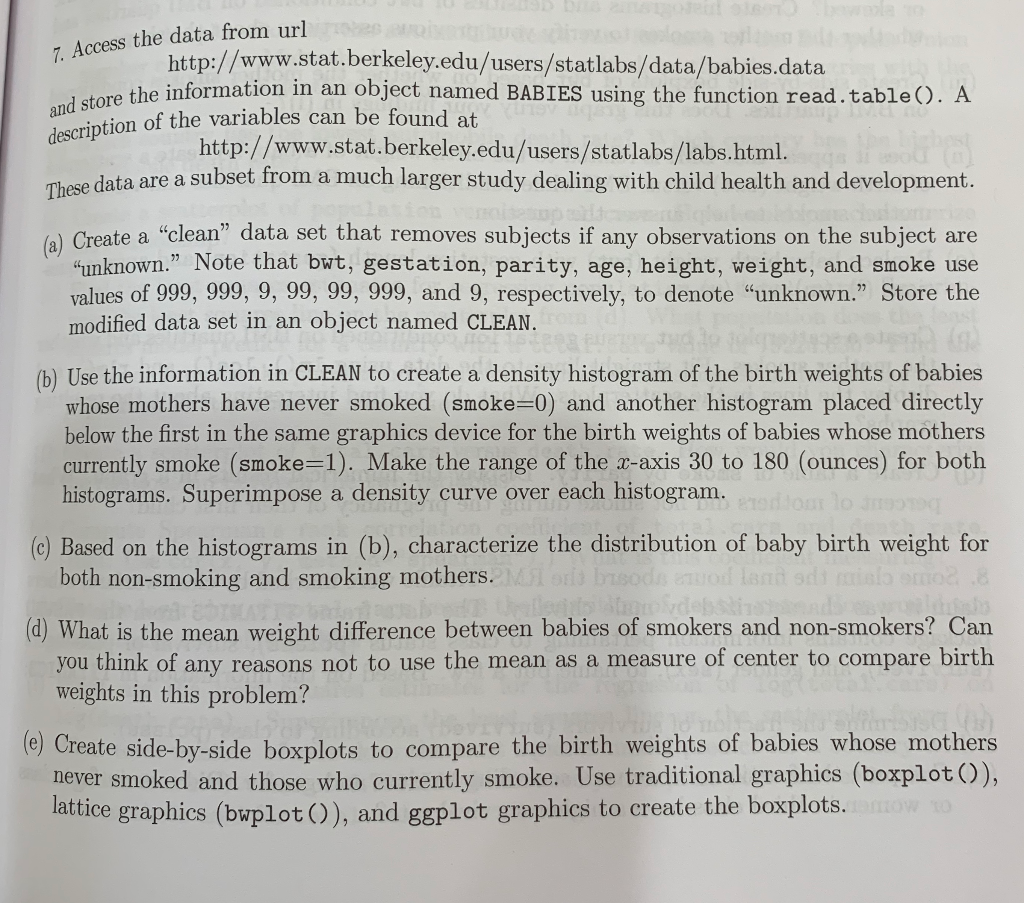
7. Access the data from url http://www.stat.berkeley.edu/users/statlabs/data/babies.data ore the information in an object named BABIES using the function read.tableO. A an description of the variables can be found at http://www.stat.berkeley.edu/users/statlabs/labs.html. These data are a subset from a much larger study dealing with child health and development. al Create a "clean" data set that removes subjects if any observations on the subject are unknown." Note that bwt, gestation, parity, age, height, weight, and smoke use values of 999, 999, 9, 99, 99, 999, and 9, respectively, to denote "unknown." Store the modified data set in an object named CLEAN. (b) Use the information in CLEAN to create a density histogram of the birth weights of babies whose mothers have never smoked (smoke-0) and another histogram placed directly below the first in the same graphics device for the birth weights of babies whose mthers currently smoke (smoke-1). Make the range of the a-axis 30 to 180 (ounces) for both histograms. Superimpose a density curve over each histogram. (c) Based on the histograms in (b), characterize the distribution of baby birth weight for both non-smoking and smoking mothers. (d) What is the mean weight difference between babies of smokers and non-smokers? Can you think of any reasons not to use the mean as a measure of center to compare birth weights in this problem? e) Create side-by-side boxplots to compare the birth weights of babies whose mothers never smoked and those who currently smoke. Use traditional graphics (boxplot)), attice graphics (bwplot )), and ggplot graphics to create the boxplots. 7. Access the data from url http://www.stat.berkeley.edu/users/statlabs/data/babies.data ore the information in an object named BABIES using the function read.tableO. A an description of the variables can be found at http://www.stat.berkeley.edu/users/statlabs/labs.html. These data are a subset from a much larger study dealing with child health and development. al Create a "clean" data set that removes subjects if any observations on the subject are unknown." Note that bwt, gestation, parity, age, height, weight, and smoke use values of 999, 999, 9, 99, 99, 999, and 9, respectively, to denote "unknown." Store the modified data set in an object named CLEAN. (b) Use the information in CLEAN to create a density histogram of the birth weights of babies whose mothers have never smoked (smoke-0) and another histogram placed directly below the first in the same graphics device for the birth weights of babies whose mthers currently smoke (smoke-1). Make the range of the a-axis 30 to 180 (ounces) for both histograms. Superimpose a density curve over each histogram. (c) Based on the histograms in (b), characterize the distribution of baby birth weight for both non-smoking and smoking mothers. (d) What is the mean weight difference between babies of smokers and non-smokers? Can you think of any reasons not to use the mean as a measure of center to compare birth weights in this problem? e) Create side-by-side boxplots to compare the birth weights of babies whose mothers never smoked and those who currently smoke. Use traditional graphics (boxplot)), attice graphics (bwplot )), and ggplot graphics to create the boxplots
Step by Step Solution
There are 3 Steps involved in it

Get step-by-step solutions from verified subject matter experts