

Question: Assignment 2 1. The data below are the marks obtained by 30 candidates in an aptitude assessment 57 71 85 47 50 71 52 76
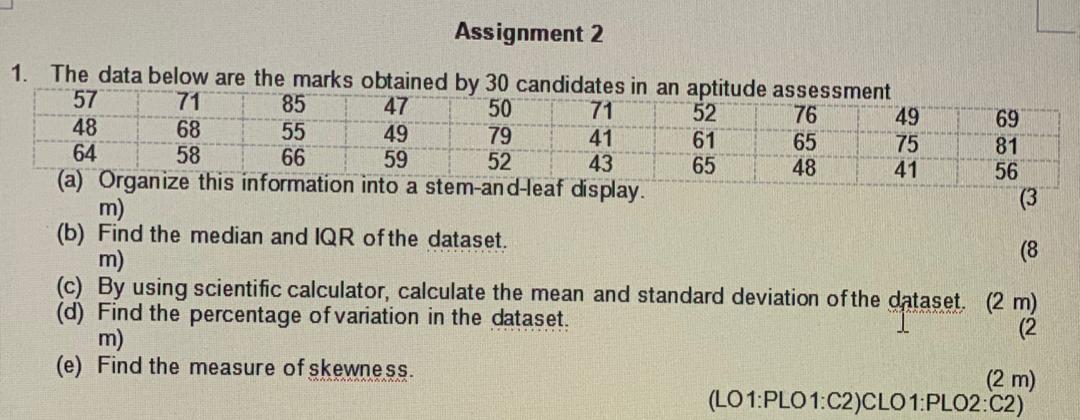
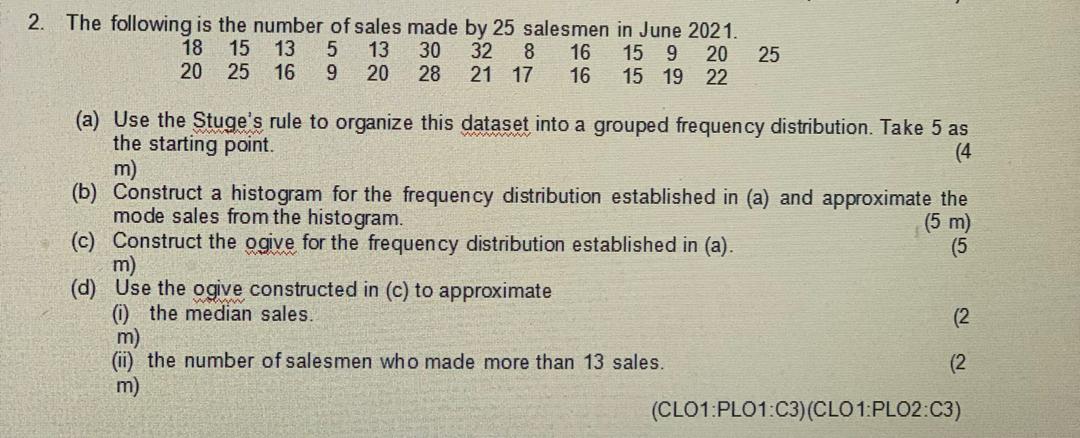
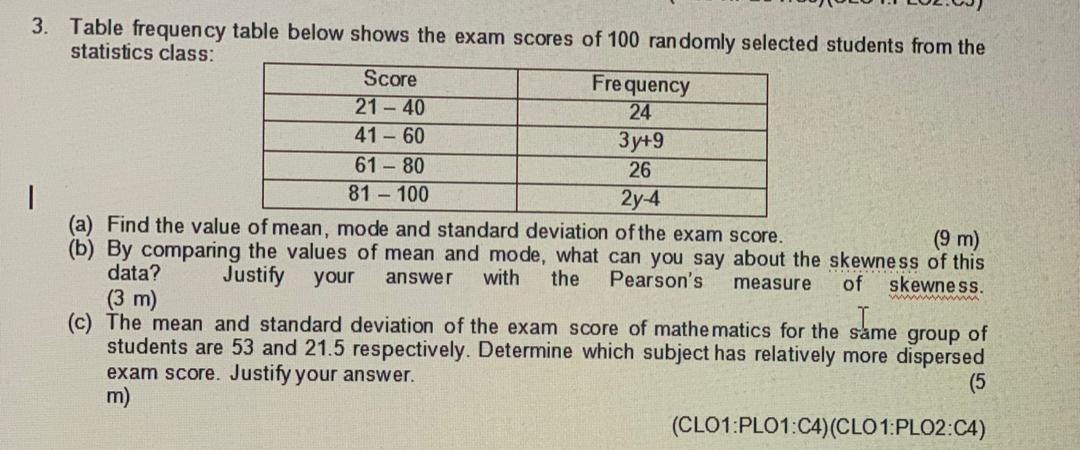
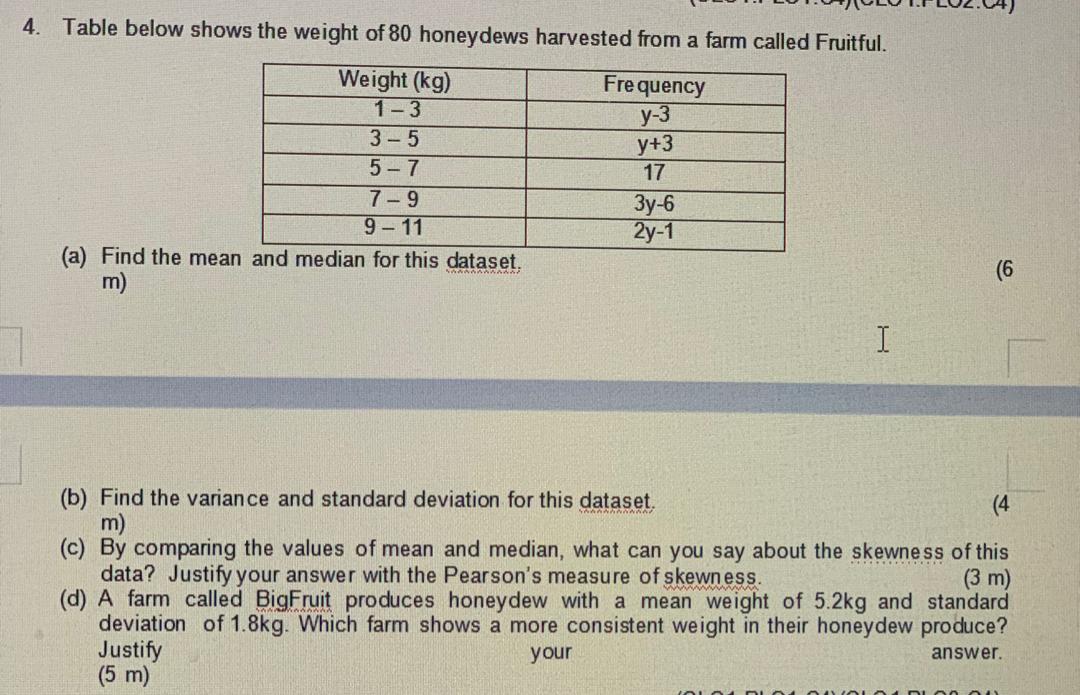
Assignment 2 1. The data below are the marks obtained by 30 candidates in an aptitude assessment 57 71 85 47 50 71 52 76 49 69 48 68 55 49 79 41 61 65 75 81 64 58 66 59 52 43 65 48 41 56 (a) Organize this information into a stem-and-leaf display. (3 m) (b) Find the median and IQR of the dataset. (8 m) (c) By using scientific calculator, calculate the mean and standard deviation of the dataset. (2 m) (d) Find the percentage of variation in the dataset. (2 m) (e) Find the measure of skewness. (2 m) (LO1:PLO1:C2)CLO1:PLO2:C2)2. The following is the number of sales made by 25 salesmen in June 2021. 18 15 13 5 13 30 32 16 15 9 20 20 25 16 9 20 28 21 17 16 15 19 22 (a) Use the Stuge's rule to organize this dataset into a grouped frequency distribution. Take 5 as the starting point. (4 m) (b) Construct a histogram for the frequency distribution established in (a) and approximate the mode sales from the histogram. (5 m) (c) Construct the ogive for the frequency distribution established in (a). (5 m) (d) Use the ogive constructed in (c) to approximate (i) the median sales. (2 the number of salesmen who made more than 13 sales. (2 (CLO1:PLO1:C3) (CLO1:PLO2:C3)3. Table frequency table below shows the exam scores of 100 randomly selected students from the statistics class: Score Frequency 21 - 40 24 41 - 60 3y+9 61 - 80 26 81 - 100 2y-4 (a) Find the value of mean, mode and standard deviation of the exam score. (9 m) (b) By comparing the values of mean and mode, what can you say about the skewness of this data? Justify your answer with the Pearson's measure of skewness. wwwwwwwwwww (3 m) (c) The mean and standard deviation of the exam score of mathematics for the same group of I. students are 53 and 21.5 respectively. Determine which subject has relatively more dispersed exam score. Justify your answer. (5 m (CLO1:PLO1:C4) (CLO1:PLO2:C4)4. Table below shows the weight of 80 honeydews harvested from a farm called Fruitful. Weight (kg) Frequency 1-3 y-3 3-5 y+3 5-7 17 7-9 3y-6 9 - 11 2y-1 (a) Find the mean and median for this dataset, (6 m) H (b) Find the variance and standard deviation for this dataset (4 m) (c) By comparing the values of mean and median, what can you say about the skewness of this data? Justify your answer with the Pearson's measure of skewness. (3 m) (d) A farm called BigFruit produces honeydew with a mean weight of 5.2kg and standard deviation of 1.8kg. Which farm shows a more consistent weight in their honeydew produce? Justify your answer. (5 m)
Step by Step Solution
There are 3 Steps involved in it

Get step-by-step solutions from verified subject matter experts