

Question: QUESTION 1 The data below are the marks obtained by 40 students in an examination. 68 49 52 69 62 57 48 64 54 71
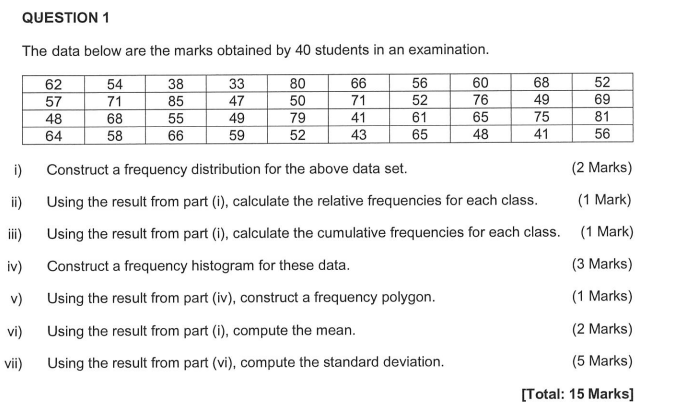
QUESTION 1 The data below are the marks obtained by 40 students in an examination. 68 49 52 69 62 57 48 64 54 71 68 58 38 85 55 66 33 47 49 59 80 50 79 52 66 71 41 43 56 52 61 65 60 76 65 48 75 81 41 56 i) Construct a frequency distribution for the above data set. Using the result from part (i), calculate the relative frequencies for each class. (2 Marks) (1 Mark) ii) iii) Using the result from part(), calculate the cumulative frequencies for each class. (1 Mark) iv) (3 Marks) v) Construct a frequency histogram for these data. Using the result from part (iv), construct a frequency polygon. Using the result from part (1), compute the mean. Using the result from part (vi), compute the standard deviation. vi) (1 Marks) (2 Marks) (5 Marks) [Total: 15 Marks] vii)
Step by Step Solution
There are 3 Steps involved in it

Get step-by-step solutions from verified subject matter experts