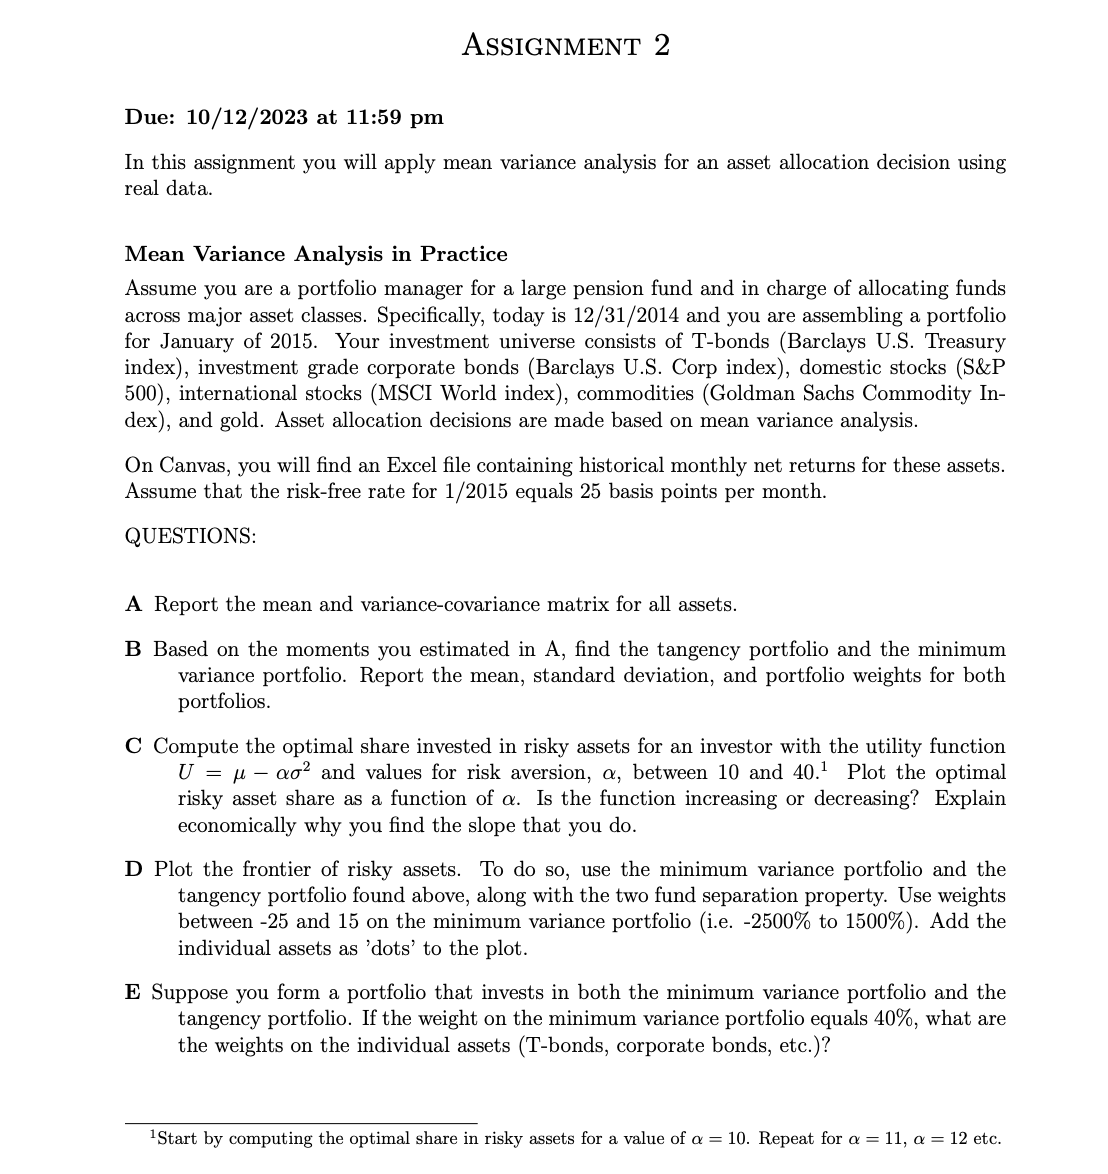
Question: ASSIGNMENT 2 Due: 10/12/2023 at 11:59 pm In this assignment you will apply mean variance analysis for an asset allocation decision using real data. Mean

ASSIGNMENT 2 Due: 10/12/2023 at 11:59 pm In thisASSIGNMENT 2 Due: 10/12/2023 at 11:59 pm In thisASSIGNMENT 2 Due: 10/12/2023 at 11:59 pm In this
ASSIGNMENT 2 Due: 10/12/2023 at 11:59 pm In this assignment you will apply mean variance analysis for an asset allocation decision using real data. Mean Variance Analysis in Practice Assume you are a portfolio manager for a large pension fund and in charge of allocating funds across major asset classes. Specifically, today is 12/31/2014 and you are assembling a portfolio for January of 2015. Your investment universe consists of T-bonds (Barclays U.S. Treasury index), investment grade corporate bonds (Barclays U.S. Corp index), domestic stocks (S&P 500), international stocks (MSCI World index), commodities (Goldman Sachs Commodity In- dex), and gold. Asset allocation decisions are made based on mean variance analysis. On Canvas, you will find an Excel file containing historical monthly net returns for these assets. Assume that the risk-free rate for 1/2015 equals 25 basis points per month. QUESTIONS: A Report the mean and variance-covariance matrix for all assets. B Based on the moments you estimated in A, find the tangency portfolio and the minimum variance portfolio. Report the mean, standard deviation, and portfolio weights for both portfolios. C Compute the optimal share invested in risky assets for an investor with the utility function U = pu ac? and values for risk aversion, a, between 10 and 40.! Plot the optimal risky asset share as a function of . Is the function increasing or decreasing? Explain economically why you find the slope that you do. D Plot the frontier of risky assets. To do so, use the minimum variance portfolio and the tangency portfolio found above, along with the two fund separation property. Use weights between -25 and 15 on the minimum variance portfolio (i.e. -2500% to 1500%). Add the individual assets as 'dots' to the plot. E Suppose you form a portfolio that invests in both the minimum variance portfolio and the tangency portfolio. If the weight on the minimum variance portfolio equals 40%, what are the weights on the individual assets (T-bonds, corporate bonds, etc.)? IStart by computing the optimal share in risky assets for a value of o = 10. Repeat for o = 11, a = 12 ete. Fixed Income Equities Commodities Date T-Bonds Corp. Bonds S&P 500 MSCI World GSCI Gold 197301 -0.010 -0.002 -0.0168 0.003 0.034 0.020 197302 -0.003 0.004 -0.0338 0.008 0.043 0.292 197303 0.000 0.000 -0.0011 0.002 -0.024 0.058 197304 0.009 0.010 -0.0401 -0.050 0.060 0.005 197305 0.002 -0.004 -0.0140 -0.002 0.182 0.262 197306 0.003 -0.011 -0.0052 0.007 -0.017 0.079 9 197307 -0.021 -0.035 0.0391 0.025 0.258 -0.067 10 197308 0.020 0.037 -0.0315 -0.041 0.025 -0.097 11 197309 0.022 0.032 0.0422 0.030 -0.050 -0.036 12 197310 0.008 -0.011 0.0003 0.011 -0.053 -0.030 13 197311 0.006 0.011 -0.1072 -0.129 0.052 0.031 14 197312 -0.001 -0.013 0.0180 -0.007 0.105 0.120 15 197401 0.007 0.001 -0.0081 0.009 0.112 0.187 16 197402 0.003 0.002 0.0020 0.016 -0.005 0.272 17 197403 -0.016 -0.030 -0.0218 -0.024 -0.115 0.021 18 197404 -0.008 -0.030 -0.0376 -0.016 0.011 -0.026 19 197405 0.012 0.007 -0.0269 -0.039 -0.068 -0.071 20 197406 0.000 -0.045 -0.0128 -0.030 0.124 -0.062 21 197407 0.001 -0.009 -0.0767 -0.058 0.238 0.049 22 197408 0.001 -0.025 -0.0822 -0.095 -0.049 0.008 23 197409 0.025 0.012 -0.1175 -0.092 0.121 -0.050 24 197410 0.012 0.073 0.1681 0.097 0.090 0.128 25 197411 0.020 -0.003 -0.0457 -0.014 0.019 0.094 26 197412 0.012 -0.008 -0.0180 -0.015 -0.083 0.030 27 197501 0.012 0.068 0.1236 0.147 -0.156 -0.060 28 197502 0.012 0.020 0.0675 0.090 -0.104 0.031 29 197503 -0.004 -0.032 0.0240 0.008 0.084 -0.022 30 197504 -0.014 -0.009 0.0494 0.043 -0.046 -0.058 31 197505 0.020 0.026 0.0512 0.025 -0.015 0.002 32 197506 0.004 0.027 0.0462 0.014 0.016 -0.010 33 197507 -0.003 -0.002 -0.0655 0.054 0.078 0.002 4 197508 0.004 -0.005 -0.0157 -0.014 0.096 -0.029 35 197509 -0.002 -0.012 -0.0323 -0.041 0.011 -0.144 36 197510 0.031 0.048 0.0649 0.070 -0.080 0.037 37 197511 -0.001 -0.005 0.0301 0.028 -0.012 -0.036 38 197512 0.019 0.035 -0.0105 0.002 -0.026 0.014 39 197601 0.010 0.029 0.1201 0.090 -0.048 -0.087 40 197602 0.002 0.010 -0.0058 -0.007 0.057 0.034 41 197603 0.010 0.015 0.0326 0.013 0.002 -0.021 42 197604 0.007 0.004 -0.0096 -0.006 0.038 -0.010 43 197605 -0.007 -0.009 -0.0081 -0.016 0.018 -0.023 44 197606 0.013 0.015 0.0440 0.032 -0.017 -0.012 45 197607 0.010 0.014 -0.0072 -0.008 -0.089 -0.092 46 197608 0.014 0.022 0.0016 -0.001 -0.028 -0.083 47 197609 0.009 0.017 0.0244 0.009 -0.099 0.127 48 197610 0.012 0.010 -0.0202 -0.034 -0.012 0.053 49 197611 0.023 0.025 -0.0010 -0.003 0.014 0.064 50 197612 0.009 0.028 0.0538 0.076 0.050 0.034\f

Step by Step Solution

There are 3 Steps involved in it

1 Expert Approved Answer
Step: 1 Unlock blur-text-image
Question Has Been Solved by an Expert!

Get step-by-step solutions from verified subject matter experts

Step: 2 Unlock
Step: 3 Unlock

Students Have Also Explored These Related Finance Questions!