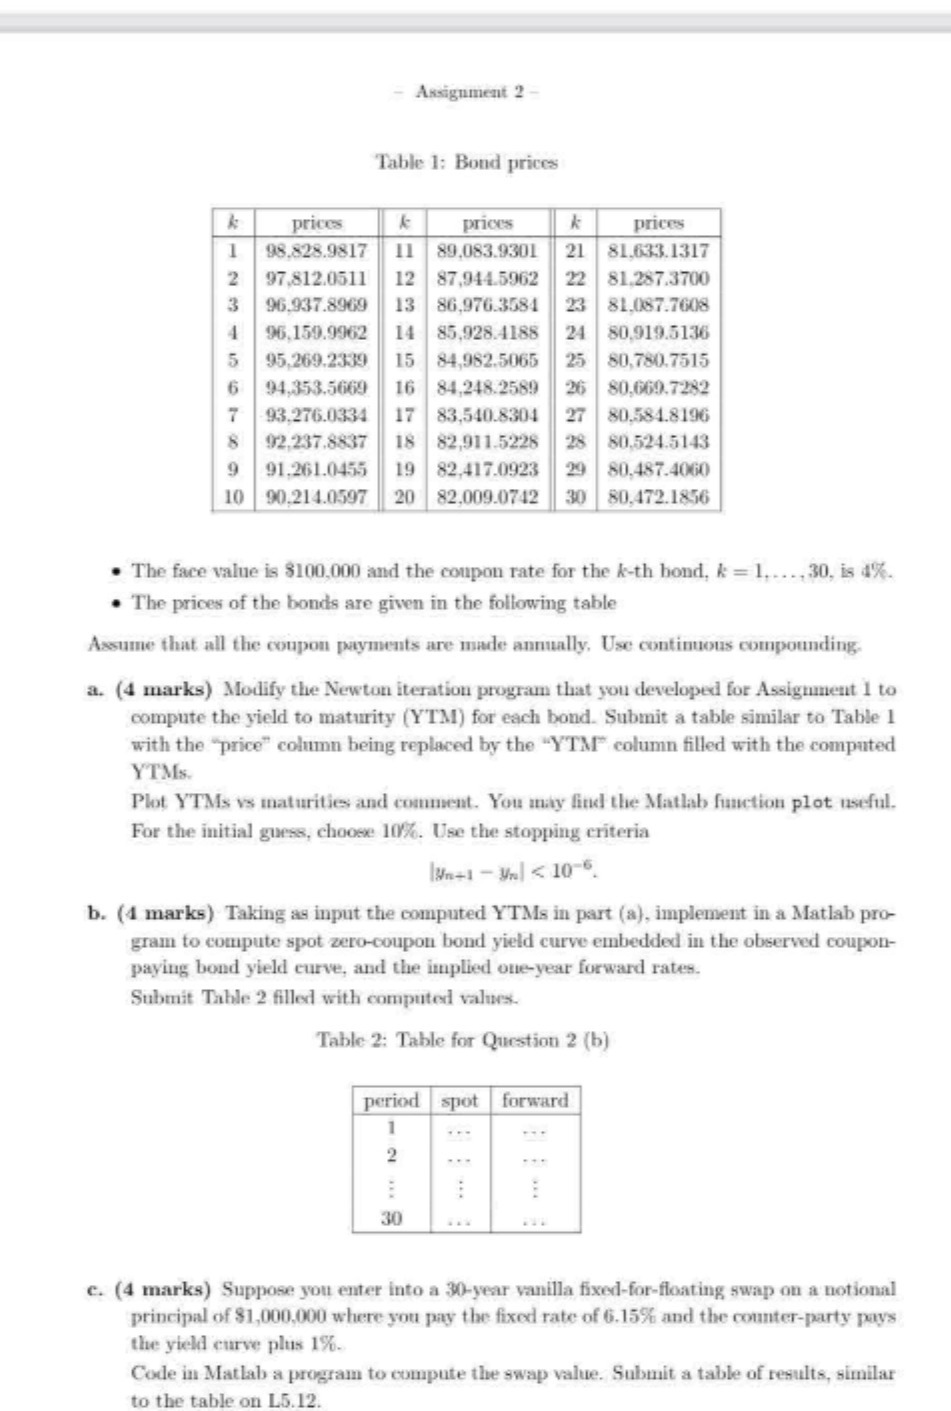
Question: Assignment 2 - Table 1: Bond prices prices K prices k prices 98.828.9817 11 89,083.9301 21 81,633.1317 97.812.0511 12 87,944.5962 22 81.287.3700 96.937.8969 13 86,976.3584

Assignment 2 - Table 1: Bond prices prices K
Assignment 2 - Table 1: Bond prices prices K prices k prices 98.828.9817 11 89,083.9301 21 81,633.1317 97.812.0511 12 87,944.5962 22 81.287.3700 96.937.8969 13 86,976.3584 23 81.087.7608 95.159.9962 14 85,928.4188 24 80,919.5136 95,269.2339 15 84,982.5065 25 80,780.7515 94,353.5669 16 84,248.2589 26 80,669.7282 93.276.0334 17 83,540.8304 27 80.584.8196 92,237.8837 18 82,911.5228 28 80,524.5143 91,261.0455 19 82,417.0923 29 80,487-4060 10 90.214.0597 20 82,009.0742 30 80,472.1856 . The face value is $100,000 and the coupon rate for the k-th bond, & = 1. ..., 30, is 4%. . The prices of the bonds are given in the following table Assume that all the coupon payments are made annually, Use continuous compounding. a. (4 marks) Modify the Newton iteration program that you developed for Assignment 1 to compute the yield to maturity (YTM) for each bond. Submit a table similar to Table 1 with the "price" column being replaced by the "YTM" column filled with the computed YTMs. Plot YTMs vs maturities and comment. You may find the Matlab function plot useful. For the initial guess, choose 10%. Use the stopping criteria In+1 - Unl

Step by Step Solution

There are 3 Steps involved in it

1 Expert Approved Answer
Step: 1 Unlock blur-text-image
Question Has Been Solved by an Expert!

Get step-by-step solutions from verified subject matter experts

Step: 2 Unlock
Step: 3 Unlock

Students Have Also Explored These Related Accounting Questions!