

Question: Assignment 3 Parking lot simulation and simulation - based analysis of service quality Simulated system The short - term parking at the airport provides parking
Assignment
Parking lot simulation and simulationbased analysis of service quality
Simulated system
The shortterm parking at the airport provides parking spots for periods that are shorter than an hour. For longer waiting times customers have to use other parking facilities or to pay an increased rate. At the entrance to the parking lot, customers take tickets with the arrival time for future payment. When leaving the parking lot the customer pays the corresponding fee at the machine or to the cashier. Now there are two machines and one cashier accepting payments. Historical data provides information about arrivals, ticket getting, parking and payment times see Tables and The maximum time for using a parking lot free of charge is minutes. The charge for the first hour is Euro. Every hour after that costs Euros. Customers do not arrive regularly as they are trying to get to the parking lot just before an airplane lands or checkin starts. Sometimes before being able to leave the parking lot, customers have to queue to make the payment.
The goal of this project is to analyse the system in its current state in order to understand whether customers pay for the parking or for low service level.
In Figure there is the simplified customer's process diagram, where is waiting time in a queue for tickets, is ticketgetting time, is parking time, is waiting time in a queue for payment, and is payment time. The total time spent in system is equal to the sum of all times mentioned above, every customer's parking time is
Figure The simplified diagram of simulated customer's process
As shown in Figure the main time moments for payment calculation are as follows. At time, moment of parking lot entering event the arrival time in parking is registered. At payment machine seizing time moment event the real observed time in parking is calculated and the payment amount is determined and paid, as well as the total payment amount of all customers is incremented.
RTU, ITI,
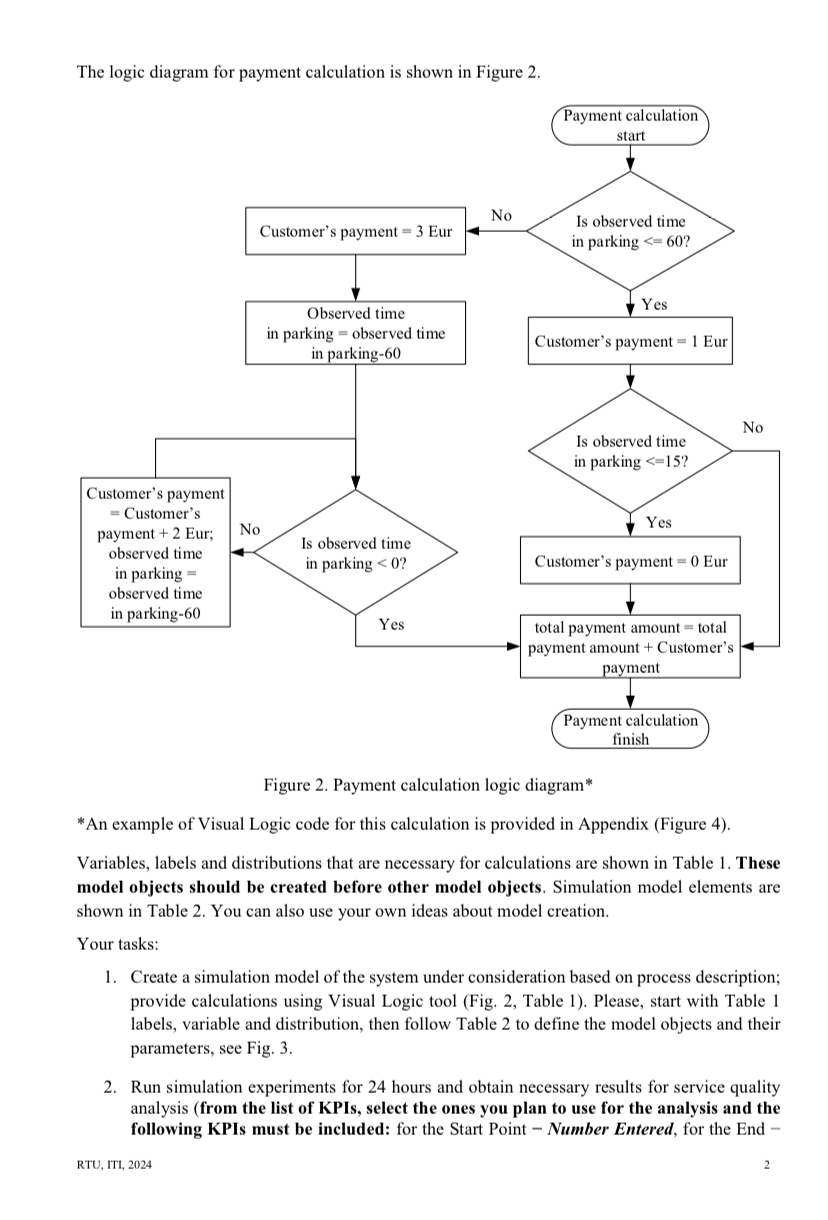
The logic diagram for payment calculation is shown in Figure
Figure Payment calculation logic diagram
An example of Visual Logic code for this calculation is provided in Appendix Figure
Variables, labels and distributions that are necessary for calculations are shown in Table These model objects should be created before other model objects. Simulation model elements are shown in Table You can also use your own ideas about model creation.
Your tasks:
Create a simulation model of the system under consideration based on process description; provide calculations using Visual Logic tool Fig Table Please, start with Table labels, variable and distribution, then follow Table to define the model objects and their parameters, see Fig.
Run simulation experiments for hours and obtain necessary results for service quality analysis from the list of KPIs, select the ones you plan to use for the analysis and the following KPIs must be included: for the Start Point Number Entered, for the End
RTU, ITI,
Step by Step Solution
There are 3 Steps involved in it
1 Expert Approved Answer
Step: 1 Unlock

Question Has Been Solved by an Expert!
Get step-by-step solutions from verified subject matter experts
Step: 2 Unlock
Step: 3 Unlock