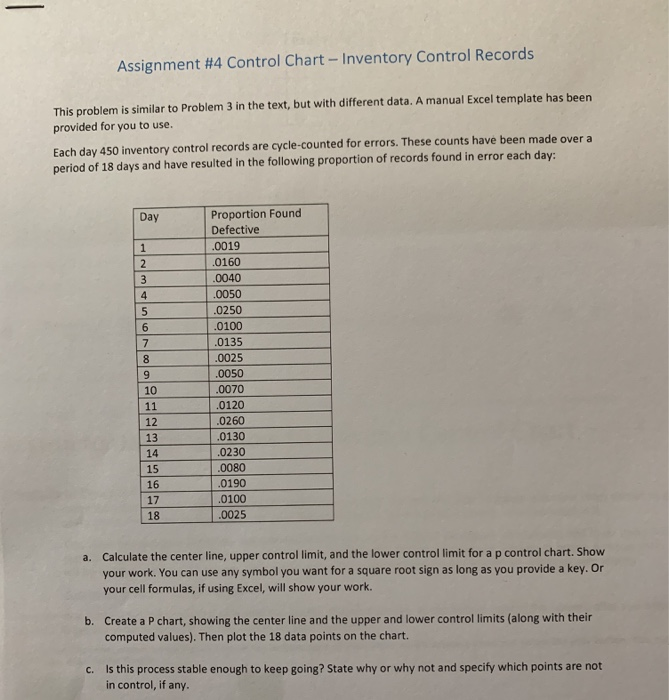
Question: Assignment #4 Control Chart - Inventory Control Records This problem is similar to Problem 3 in the text, but with different data. A manual Excel

Assignment #4 Control Chart - Inventory Control
Assignment #4 Control Chart - Inventory Control Records This problem is similar to Problem 3 in the text, but with different data. A manual Excel template has been provided for you to use. Each day 450 inventory control records are cycle-counted for errors. These counts have been made over a period of 18 days and have resulted in the following proportion of records found in error each day: Day 1 2 3 4 5 6 7 8 9 10 11 12 13 14 15 16 17 18 Proportion Found Defective .0019 .0160 .0040 .0050 .0250 .0100 .0135 .0025 .0050 .0070 .0120 .0260 .0130 .0230 .0080 .0190 .0100 .0025 a. Calculate the center line, upper controllimit, and the lower controllimit for a p control chart. Show your work. You can use any symbol you want for a square root sign as long as you provide a key. Or your cell formulas, if using Excel, will show your work. b. Create a P chart, showing the center line and the upper and lower control limits (along with their computed values). Then plot the 18 data points on the chart. c. Is this process stable enough to keep going? State why or why not and specify which points are not in control, if any

Step by Step Solution

There are 3 Steps involved in it

1 Expert Approved Answer
Step: 1 Unlock blur-text-image
Question Has Been Solved by an Expert!

Get step-by-step solutions from verified subject matter experts

Step: 2 Unlock
Step: 3 Unlock

Students Have Also Explored These Related General Management Questions!