

Question: Assignment 4: Distribution Graphs In a previous lab we obtained the frequency distribution for the GPA and gender of 71 students. A partial output for
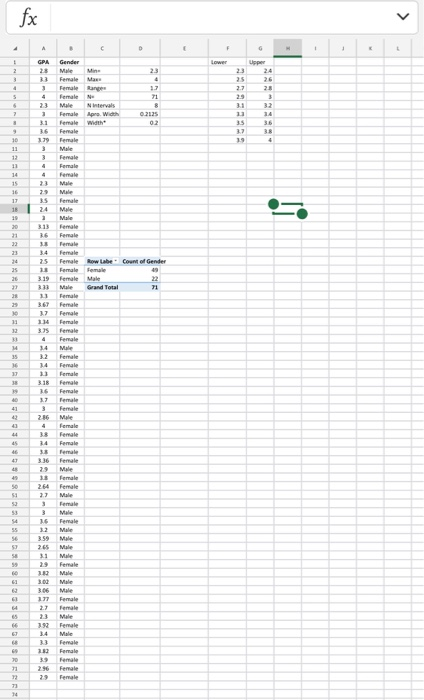
Assignment 4: Distribution Graphs In a previous lab we obtained the frequency distribution for the GPA and gender of 71 students. A partial output for the results is in the Excel file HISTOGRAM GPA AND GENDER FOR 71 STUDENTS.XLSX Now, we would like to add graphs to those frequency distributions. Using the Data Analysis tool, obtain the histogram and cumulative percentage polygon for the GPA scores. Start at the minimum value of 2.3 for the lower limit of the lower interval, and use an interval width of 0.2. The lowest confidence interval is 2.3 to 2.4 and the highest one is from 3.9 to 4. For the location of the first cell of the frequency table use C12 1. Which is the interval with the tallest bar? 2. According to the cumulative percent polygon, in which class interval will be the 50% cumulative percentage? Using the Histogram Chart tool, obtain an histogram with ten intervals or bins. 3. What is the interval width that Excell use? 4. Is there a single "peak (largest bar) in the histogram? Obtain a pie chart for gender distribution that displays the percentage of males and females. 5. What is the percentage of females? fx > A . D F Lower 23 . 2 3 . 5 GPA 23 33 3 Uppe 23 24 25 26 2.7 Gender Male Mine Female Max Female Range Female Male Nintervals Female AWON Female Width Female 3.3 71 8 0.2125 02 32 14 2 3 31 13 35 27 1 3.1 36 179 3 3 4 38 4 Male 10 11 12 11 14 15 16 17 10 20 4 > 2.9 35 24 1 313 36 33 Female Female Female Male Male Female Mile Male Female Female Female Female Female Female 22 34 25 3.19 333 RowLabe Court of Gender 49 22 Grand Total 71 28 Male Female Female Female 37 11 3.5 Female Female Male Female 34 35 14 37 38 19 3.18 36 3.7 41 2:36 44 24 33 3.36 29 Female Female Female Female Female Male Female Female Female Female Female Male Female Ferale Male Female 47 49 51 264 23 3 Male 55 56 3.59 59 3.1 29 Female Male Male Male Male Fernate Male Male Male Female Female 3.00 306 2.7 Male 192 3.4 67 2.32 39 Female Male Fernale Female Female Female Female 70 29 22 73 Assignment 4: Distribution Graphs In a previous lab we obtained the frequency distribution for the GPA and gender of 71 students. A partial output for the results is in the Excel file HISTOGRAM GPA AND GENDER FOR 71 STUDENTS.XLSX Now, we would like to add graphs to those frequency distributions. Using the Data Analysis tool, obtain the histogram and cumulative percentage polygon for the GPA scores. Start at the minimum value of 2.3 for the lower limit of the lower interval, and use an interval width of 0.2. The lowest confidence interval is 2.3 to 2.4 and the highest one is from 3.9 to 4. For the location of the first cell of the frequency table use C12 1. Which is the interval with the tallest bar? 2. According to the cumulative percent polygon, in which class interval will be the 50% cumulative percentage? Using the Histogram Chart tool, obtain an histogram with ten intervals or bins. 3. What is the interval width that Excell use? 4. Is there a single "peak (largest bar) in the histogram? Obtain a pie chart for gender distribution that displays the percentage of males and females. 5. What is the percentage of females? fx > A . D F Lower 23 . 2 3 . 5 GPA 23 33 3 Uppe 23 24 25 26 2.7 Gender Male Mine Female Max Female Range Female Male Nintervals Female AWON Female Width Female 3.3 71 8 0.2125 02 32 14 2 3 31 13 35 27 1 3.1 36 179 3 3 4 38 4 Male 10 11 12 11 14 15 16 17 10 20 4 > 2.9 35 24 1 313 36 33 Female Female Female Male Male Female Mile Male Female Female Female Female Female Female 22 34 25 3.19 333 RowLabe Court of Gender 49 22 Grand Total 71 28 Male Female Female Female 37 11 3.5 Female Female Male Female 34 35 14 37 38 19 3.18 36 3.7 41 2:36 44 24 33 3.36 29 Female Female Female Female Female Male Female Female Female Female Female Male Female Ferale Male Female 47 49 51 264 23 3 Male 55 56 3.59 59 3.1 29 Female Male Male Male Male Fernate Male Male Male Female Female 3.00 306 2.7 Male 192 3.4 67 2.32 39 Female Male Fernale Female Female Female Female 70 29 22 73
Step by Step Solution
There are 3 Steps involved in it

Get step-by-step solutions from verified subject matter experts