

Question: Assignment 4 Economics Assignment #4 - Questions Question 1 - The following table shows data for a monopolist. The first two columns provide all the
Assignment 4 Economics
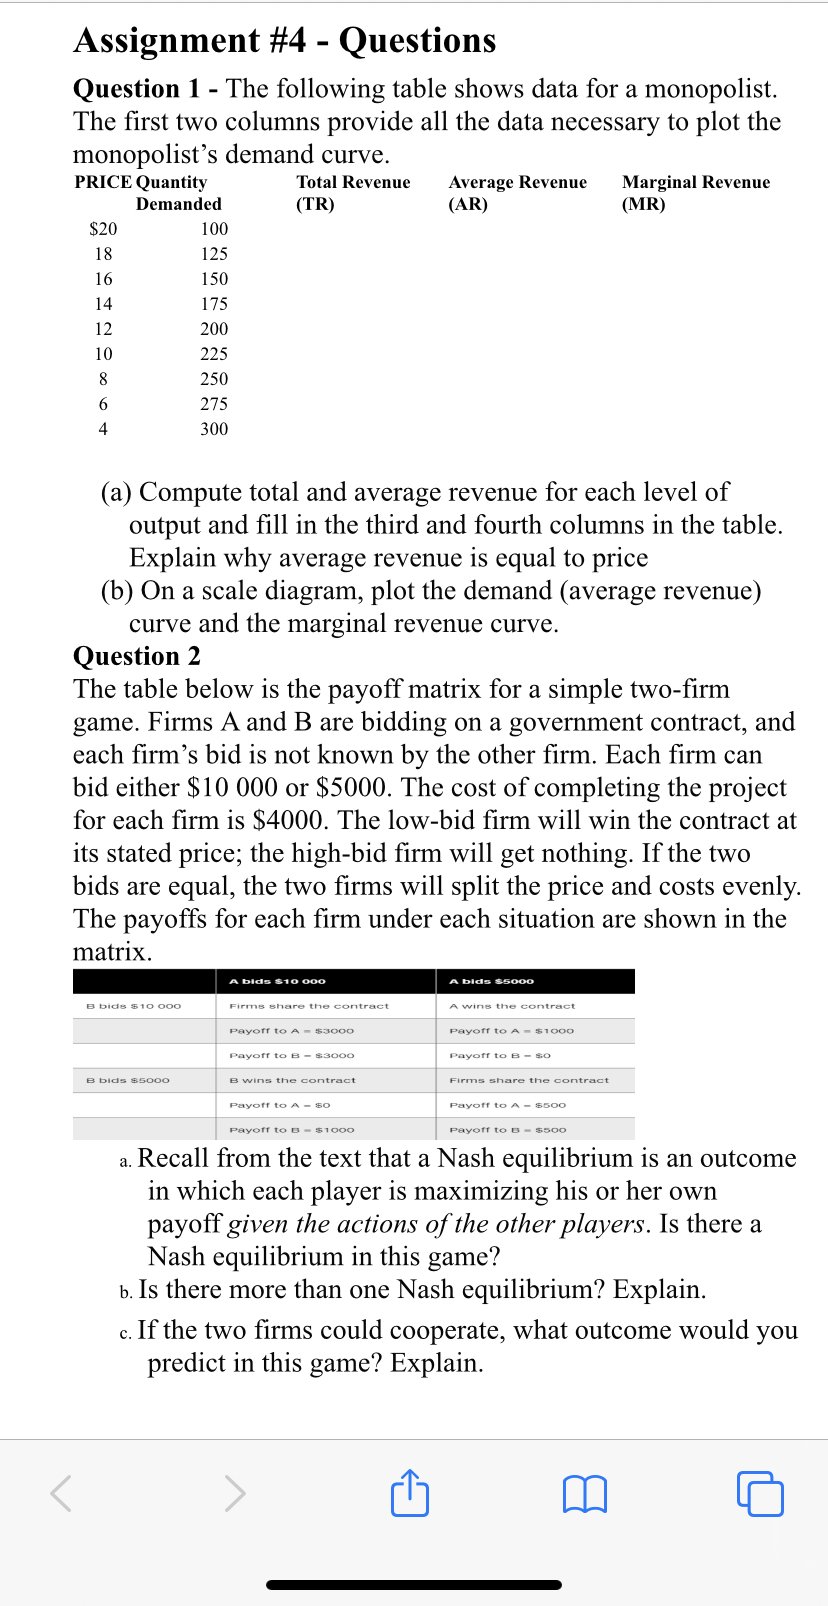
Assignment #4 - Questions Question 1 - The following table shows data for a monopolist. The first two columns provide all the data necessary to plot the monopolist's demand curve. PRICE Quantity Total Revenue Average Revenue Marginal Revenue Demanded (TR) (AR) (MR) $20 100 18 125 16 150 14 175 12 200 10 225 250 275 300 (a) Compute total and average revenue for each level of output and fill in the third and fourth columns in the table. Explain why average revenue is equal to price (b) On a scale diagram, plot the demand (average revenue) curve and the marginal revenue curve. Question 2 The table below is the payoff matrix for a simple two-firm game. Firms A and B are bidding on a government contract, and each firm's bid is not known by the other firm. Each firm can bid either $10 000 or $5000. The cost of completing the project for each firm is $4000. The low-bid firm will win the contract at its stated price; the high-bid firm will get nothing. If the two bids are equal, the two firms will split the price and costs evenly. The payoffs for each firm under each situation are shown in the matrix. A bids $10 000 A bids $5ooo B bids $10 000 Firms share the contract A wins the contract Payoff to A = $3000 Payoff to A = $1000 Payoff to B - $3000 Payoff to B - 80 B bids $5000 B wins the contract Firms share the contract Payoff to A - $0 Payoff to A - $500 off to B - $1000 Payoff to B - a. Recall from the text that a Nash equilibrium is an outcome in which each player is maximizing his or her own payoff given the actions of the other players. Is there a Nash equilibrium in this game? b. Is there more than one Nash equilibrium? Explain. c. If the two firms could cooperate, what outcome would you predict in this game? Explain
Step by Step Solution
There are 3 Steps involved in it

Get step-by-step solutions from verified subject matter experts