

Question: Economics PART 1 The following table shows a sample of the amount spent for lunch by 3 students. Note that this is ungmuped data. It
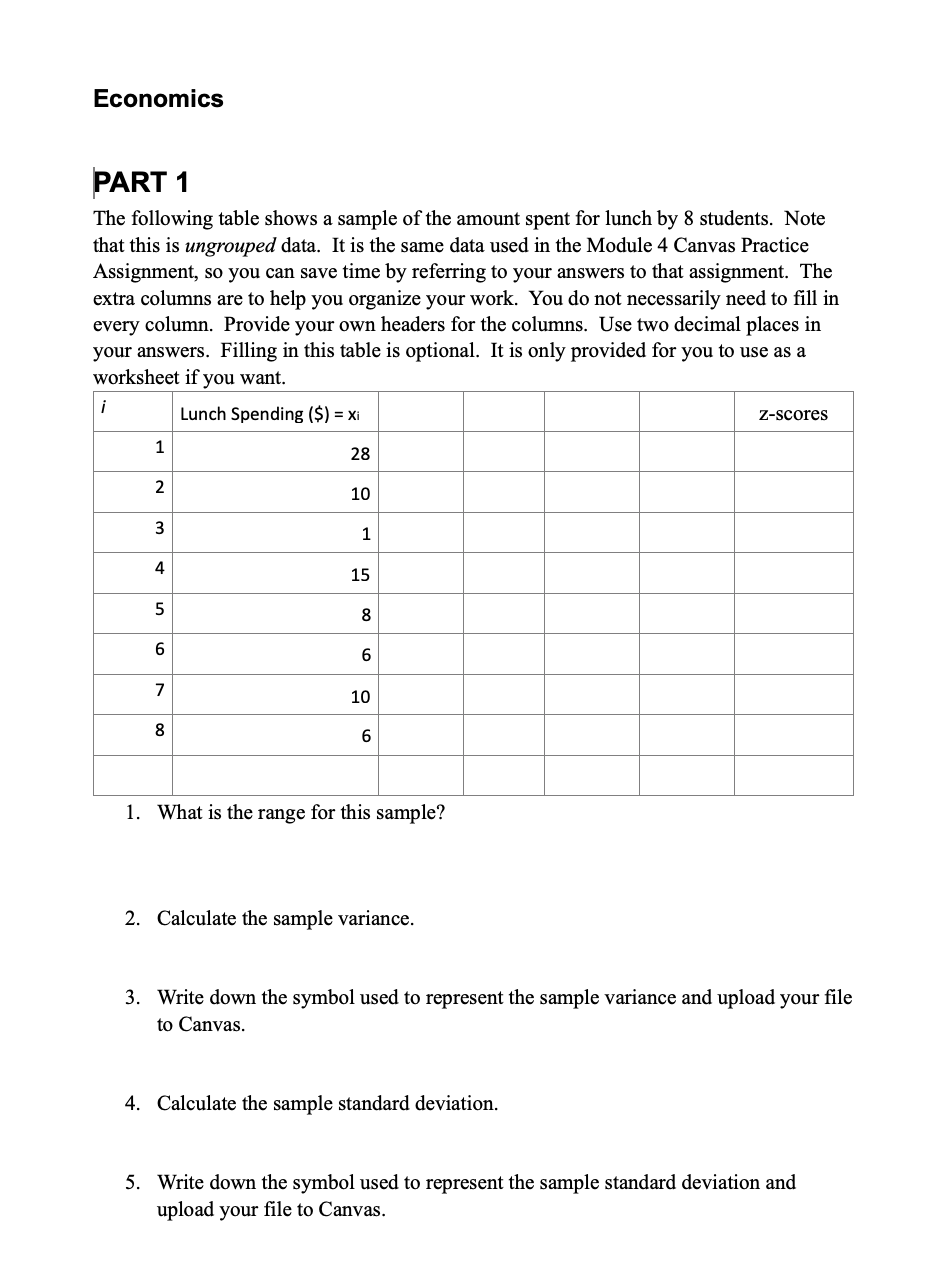
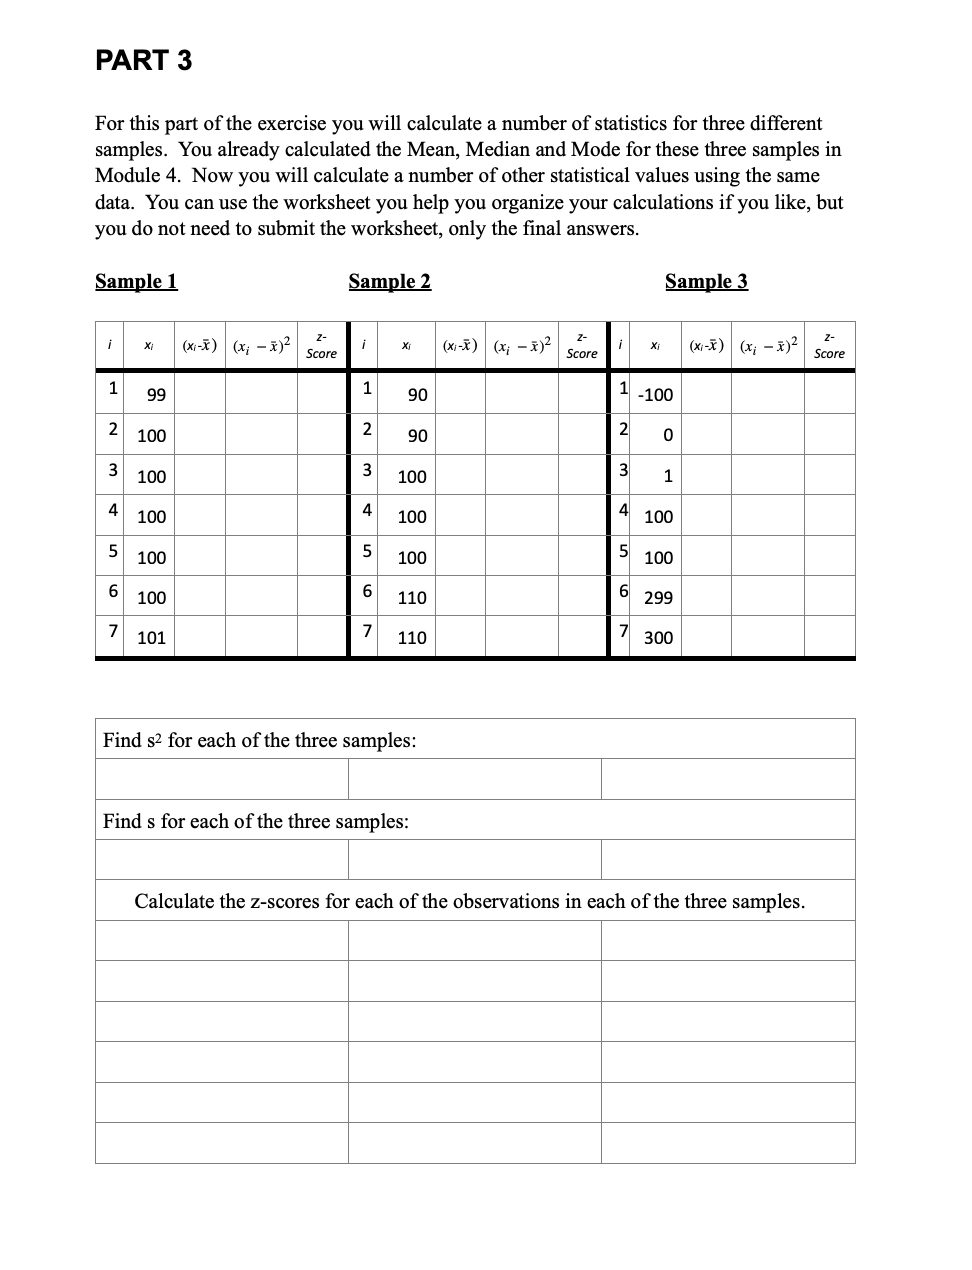
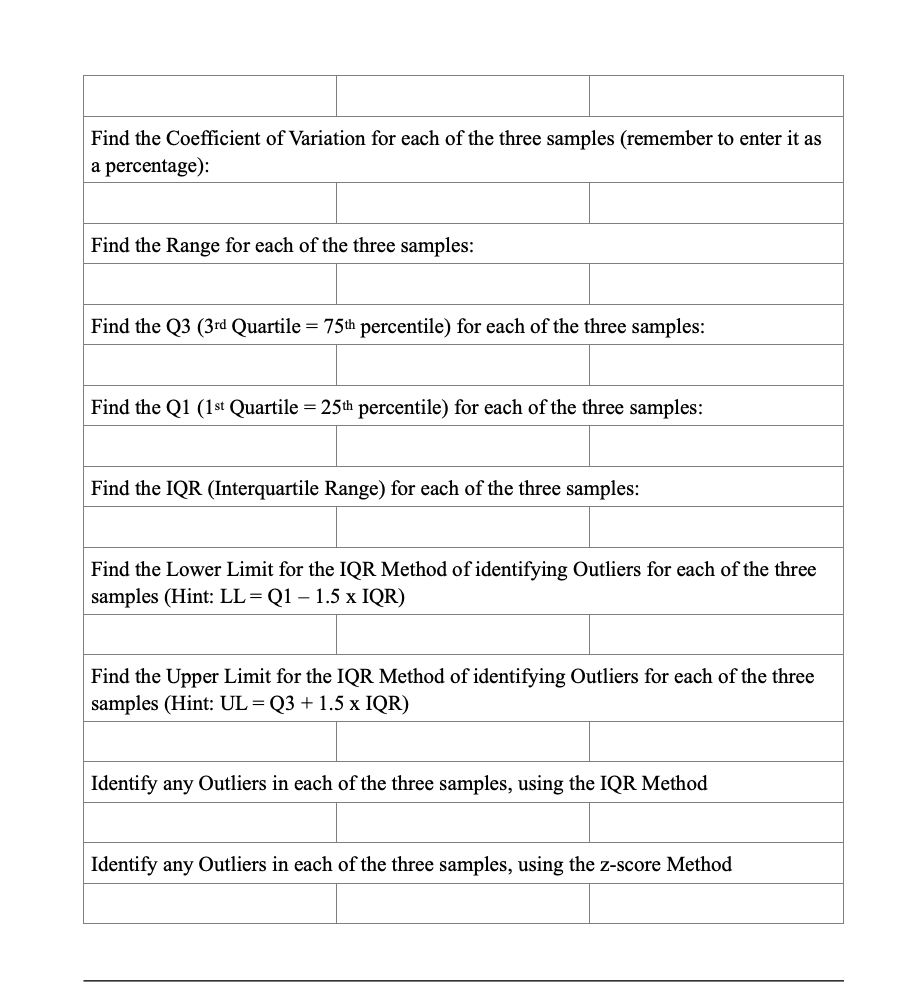
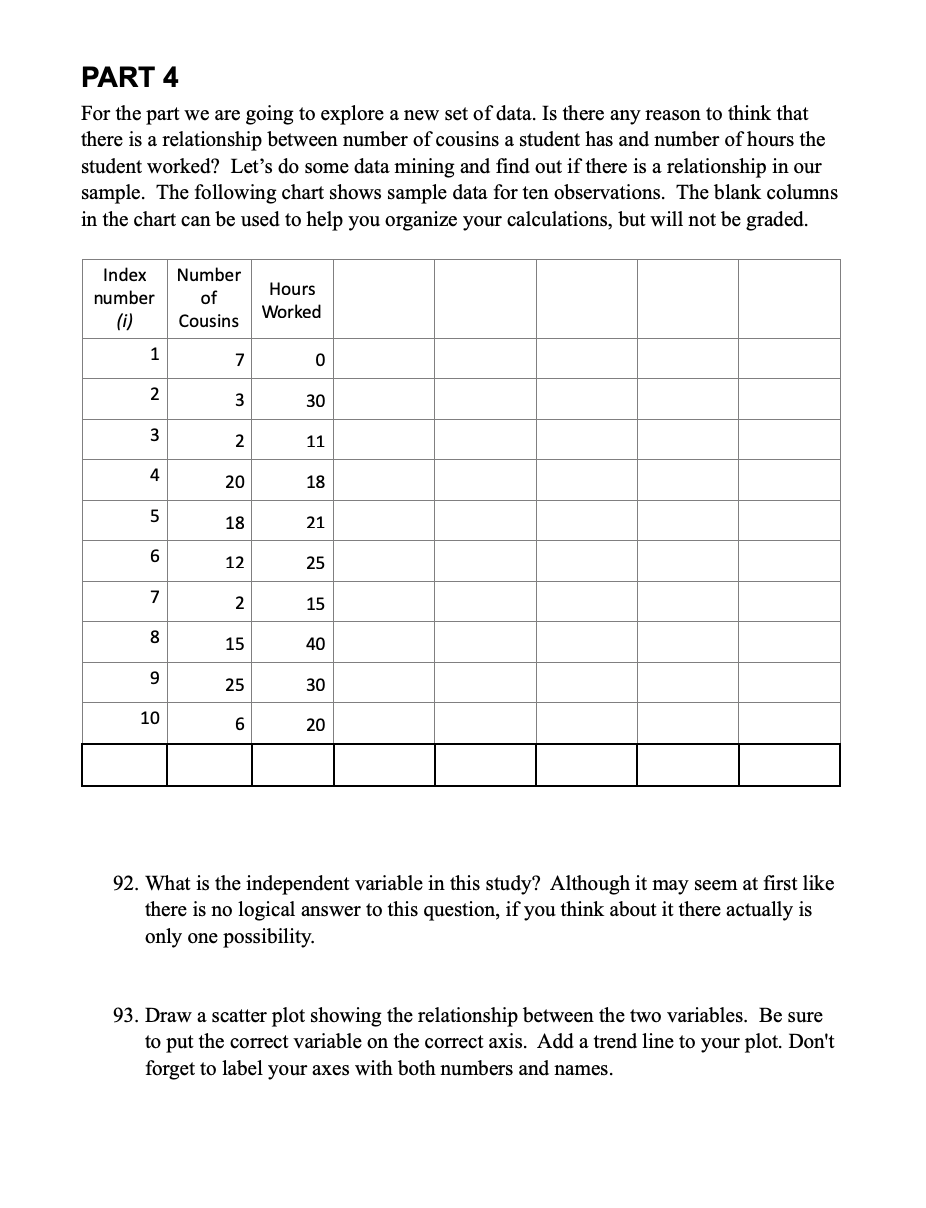
Economics PART 1 The following table shows a sample of the amount spent for lunch by 3 students. Note that this is ungmuped data. It is the same data used in the Module 4 Canvas Practice Assignment, so you can save time by referring to your answers to that assignment. The extra columns are to help you organize your work. You do not necessarily need to fill in every column. Provide your own headers for the columns. Use two decimal places in your answers. Filling in this table is optional. It is only provided for you to use as a worksheet if you want. f Lunch Spending (S) = Xi z-scores 1 23 2 1o 3 1 4 15 5 a 5 5 7 1o 3 5 1. What is the range for this sample? 2. Calculate the sample variance. 3. Write down the symbol used to represent the sample variance and upload your le to Canvas. 4. Calculate the sample standard deviation. 5. Write down the symbol used to represent the sample standard deviation and upload your le to Canvas. 6. 10. 11. 12. 13. 14. 15. 16. Calculate the Coelcient of Variation for this sample. Remember to express it as a percentage. Calculate the z-scores (to two decimal places) for each observation. 2] = Z; = Z3 = 24 = 25 = 25: Z? = 23 = According to Chehysheyfs Theorem, what percentage of the observations should be within 2.1 standard deviations of the mean? (Hint: be sure to word your answer correctly.) For this question, you do not need to use any datathis is a purely theoretical question asking what Chebyshey predicts for this situation. You will type this in as an essay question answer in Canvas because your answer requires two words in addition to your numerical answer, which should be in the form of a percentage. It will not be graded automatically by Canvas. What is the actual percentage of the observations in this sample that are within 2.1 standard deviations of the mean? (Hint: you can use your z-scores to help you calculate this. Remember the meaning of the 2-score.) For this question, use the data above question 1. 1?. Does this sample conform to Chebyshev's Theorem? Explain. You will type your answer as an essay question in Canvas. 18. Assume for the moment that lunch spending data for the entire population has a Normal, bell-shaped, distribution. Assume also that the mean and standard deviation you calculated for the sample are the actual mean and standard deviation for the population. (As we will learn later in the course, this assumption is probably not accurate, but let's assume it is for now.) According to the Empirical Rule, what percentage of the students in the population spent between $2.36 and $18.64 for lunch? (Hint: Calculate the z-scores for these two numbers and then use the Empirical Rule to nd your answer.) PART 2 Continue to use the same data as in Part 1. 19. Using the z-scores you calculated in Part 1, are there any Outliers in this data set based on the 2-score method of determining outliers? 20. Explain why you got the answer in the previous question. 21. What is the 80th percentile of the values in this sample? Give the 5-Number Summary for this sample: 22. 23. 24. 25. 26. 2?. What is the Interquartile Range (IQR) for this sample? 28. Use the [QR you calculated in the previous question to nd the Lower Limit for Outliers using the [QR Method. 29. 30. 31. 32. 33. 34. 35. 36. 37. Use the [QR to nd the Upper Limit for Outliers using the IQR Method. Are there any Outliers in this data based on the [QR Method? If there is an outlier based on the IQR Method, give the value or values. Explain how you determined the answers to the previous two questions. Draw a Box Plot for this data. (Hint: Remember how to determine and show outliers in a box plot. See Fig. 4.1? on p. 171 in the textbook for an example.) In the Census of the entire Population of Econ 5 students one semester, 16 out of the 83 students enrolled had an Excellent lunch. Calculate the Population Parameter showing the Proportion of students who had an Excellent lunch. Give three decimal places in your answer. (Hint: Proportions are always numbers between 0.000 and 1.000 inclusive. If you get a proportion that is less than 0 or greater than 1 then you did something wrong.) Give the symbol used to show the Population Parameter Proportion. In a Sample of 20 students, 5 of the 20 students had an Excellent lunch. Calculate the Sample Statistic showing the Proportion of students in this sample who had an Excellent lunch. Write the symbol used to show the Sample Statistic Proportion. Upload the le to Canvas. PART 3 For this part of the exercise you will calculate a number of statistics for three different samples. You already calculated the Mean, Median and Mode for these three samples in Module 4. Now you will calculate a number of other statistical values using the same data. You can use the worksheet you help you organize your calculations if you like, but you do not need to submit the worksheet, only the nal answers. Sample 1 Sample 2 Sample 3 i x,- (JGX} (paif :' x.- (xJ-i) (Jew-{)2 i x.- (JGX) (yai)? Score Score 199 2 100 3 100 4 100 5 100 5 100 7 101 Find 52 for each of the three samples: Find 5 for each ofthe three samples: Calculate the zscores for each of the observations in each of the three samples. Find the Coefficient of Variation for each of the three samples (remember to enter it as a percentage): Find the Range for each of the three samples: Find the Q3 (3rd Quartile = 75th percentile) for each of the three samples: Find the Q1 (1 st Quartile = 25th percentile) for each of the three samples: Find the IQR (Interquartile Range) for each of the three samples: Find the Lower Limit for the IQR Method of identifying Outliers for each of the three samples (Hint: LL = Q1 - 1.5 x IQR) Find the Upper Limit for the IQR Method of identifying Outliers for each of the three samples (Hint: UL =Q3 + 1.5 x IQR) Identify any Outliers in each of the three samples, using the IQR Method Identify any Outliers in each of the three samples, using the z-score MethodPART 4 For the part we are going to explore a new set of data. Is there any reason to think that there is a relationship between number of cousins a student has and number of hours the student worked? Let's do some data mining and nd out if there is a relationship in our sample. The following chart shows sample data for ten observations. The blank columns in the chart can be used to help you organize your calculations, but will not be graded. Index Number number of {i} Cousins Hou rs Worked 1'3 5 20 92. What is the independent variable in this study? Although it may seem at rst like there is no logical answer to this question, if you think about it there actually is only one possibility. 93. Draw a scatter plot showing the relationship between the two variables. Be sure to put the correct variable on the correct axis. Add a trend line to your plot. Don't forget to label your axes with both numbers and names. 94. Based on your plot, what type of relationship seems to exist between the two variables? Choose one of: Positive No Relationship Negative 95. Use the sample data to calculate the correlation coeicient for number of cousins and hours worked. Remember that 1.00 5 r S + 1.00 Include two decimal places in your answer. 96. Based on the correlation coefficient, what is the relationship between number of cousins and hours worked in this sample? (Multiple choice: See Canvas) Review (Multiple Choice Questions: See Canvas for choices) 97. Give an example of one of the observations in this data. 98. Give an example of one of the variables in this study. 99. Is number of cousins quantitative or categorical? 100.15 number of cousins continuous or discrete? 10 1 .What is the scale of measurement for number of cousins? Extra Credit 102.What is your conclusion about the results of your analysis about the relationship between Number of Cousins and Hours Worked? Does the conclusion make sense? What explanations can you offer? (Note: There are multiple correct answers to these questions.)
Step by Step Solution
There are 3 Steps involved in it

Get step-by-step solutions from verified subject matter experts