

Question: Assignment 5 ( 1 0 0 points ) Part ( a ) : 7 0 points Part ( b ) : 3 0 points Please
Assignment points
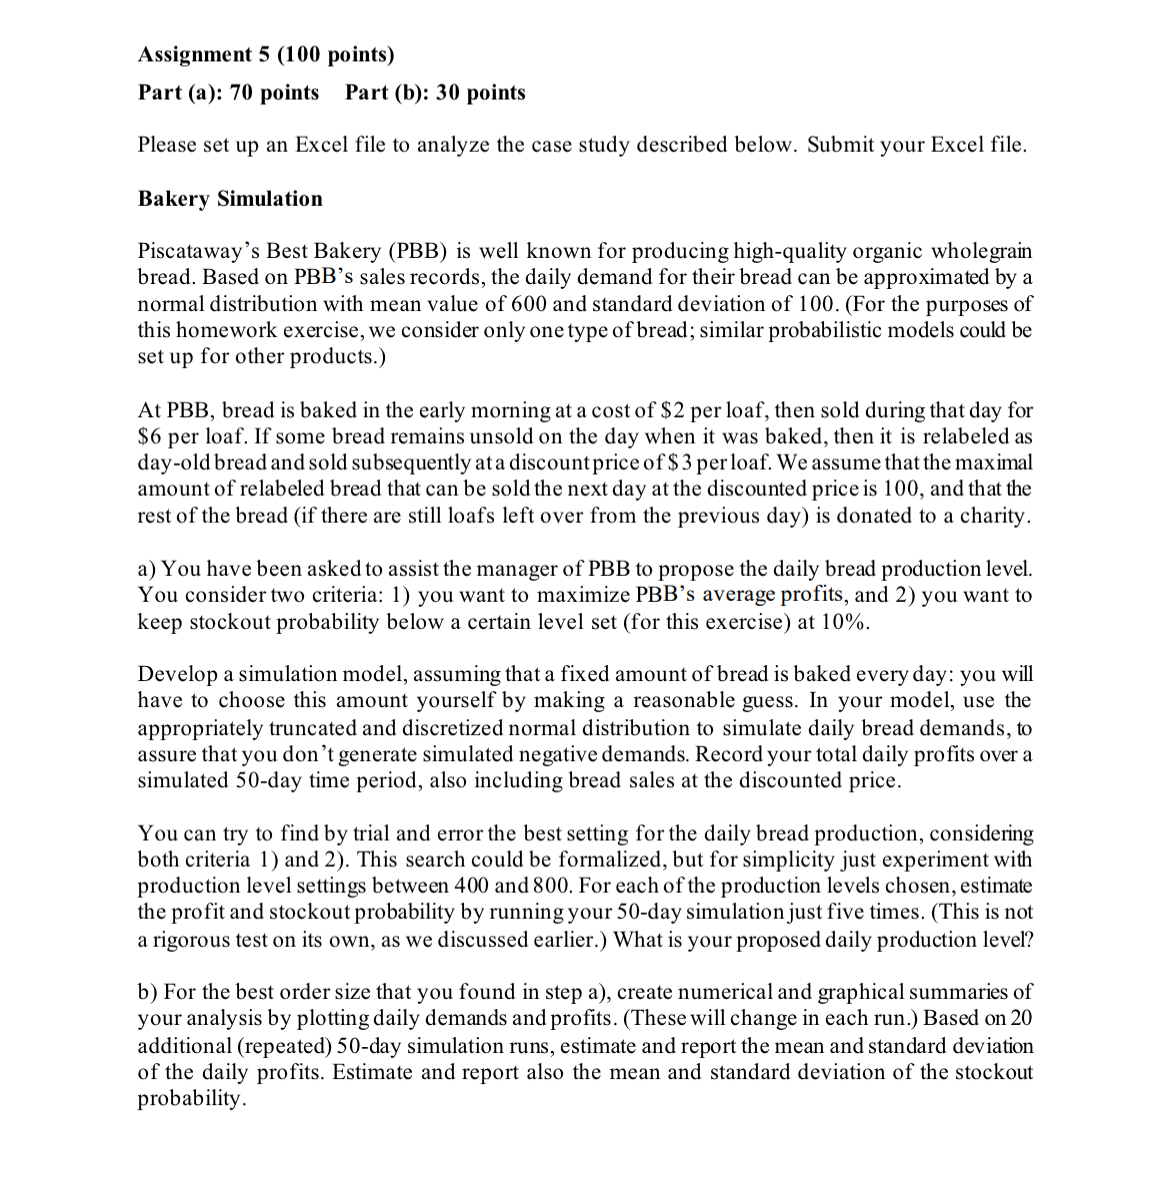
Part a: points Part b: points
Please set up an Excel file to analyze the case study described below. Submit your Excel file.
Bakery Simulation
Piscataway's Best Bakery PBB is well known for producing highquality organic wholegrain bread. Based on PBBs sales records, the daily demand for their bread can be approximated by a normal distribution with mean value of and standard deviation of For the purposes of this homework exercise, we consider only one type of bread; similar probabilistic models could be set up for other products.
At PBB bread is baked in the early morning at a cost of $ per loaf, then sold during that day for $ per loaf. If some bread remains unsold on the day when it was baked, then it is relabeled as dayold bread and sold subsequently at a discount price of $ per loaf. We assume that the maximal amount of relabeled bread that can be sold the next day at the discounted price is and that the rest of the bread if there are still loafs left over from the previous day is donated to a charity.
a You have been asked to assist the manager of PBB to propose the daily bread production level. You consider two criteria: you want to maximize PBBs average profits, and you want to keep stockout probability below a certain level set for this exercise at
Develop a simulation model, assuming that a fixed amount of bread is baked every day: you will have to choose this amount yourself by making a reasonable guess. In your model, use the appropriately truncated and discretized normal distribution to simulate daily bread demands, to assure that you don't generate simulated negative demands. Record your total daily profits over a simulated day time period, also including bread sales at the discounted price.
You can try to find by trial and error the best setting for the daily bread production, considering both criteria and This search could be formalized, but for simplicity just experiment with production level settings between and For each of the production levels chosen, estimate the profit and stockout probability by running your day simulation just five times. This is not a rigorous test on its own, as we discussed earlier. What is your proposed daily production level?
b For the best order size that you found in step a create numerical and graphical summaries of your analysis by plotting daily demands and profits. These will change in each run. Based on additional repeatedday simulation runs, estimate and report the mean and standard deviation of the daily profits. Estimate and report also the mean and standard deviation of the stockout probability.
Step by Step Solution
There are 3 Steps involved in it
1 Expert Approved Answer
Step: 1 Unlock

Question Has Been Solved by an Expert!
Get step-by-step solutions from verified subject matter experts
Step: 2 Unlock
Step: 3 Unlock