

Question: ASSIGNMENT # 8 . A binding assay was performed with a ligand binding to a receptor. The following binding data were obtained. 1 , 9
ASSIGNMENT #
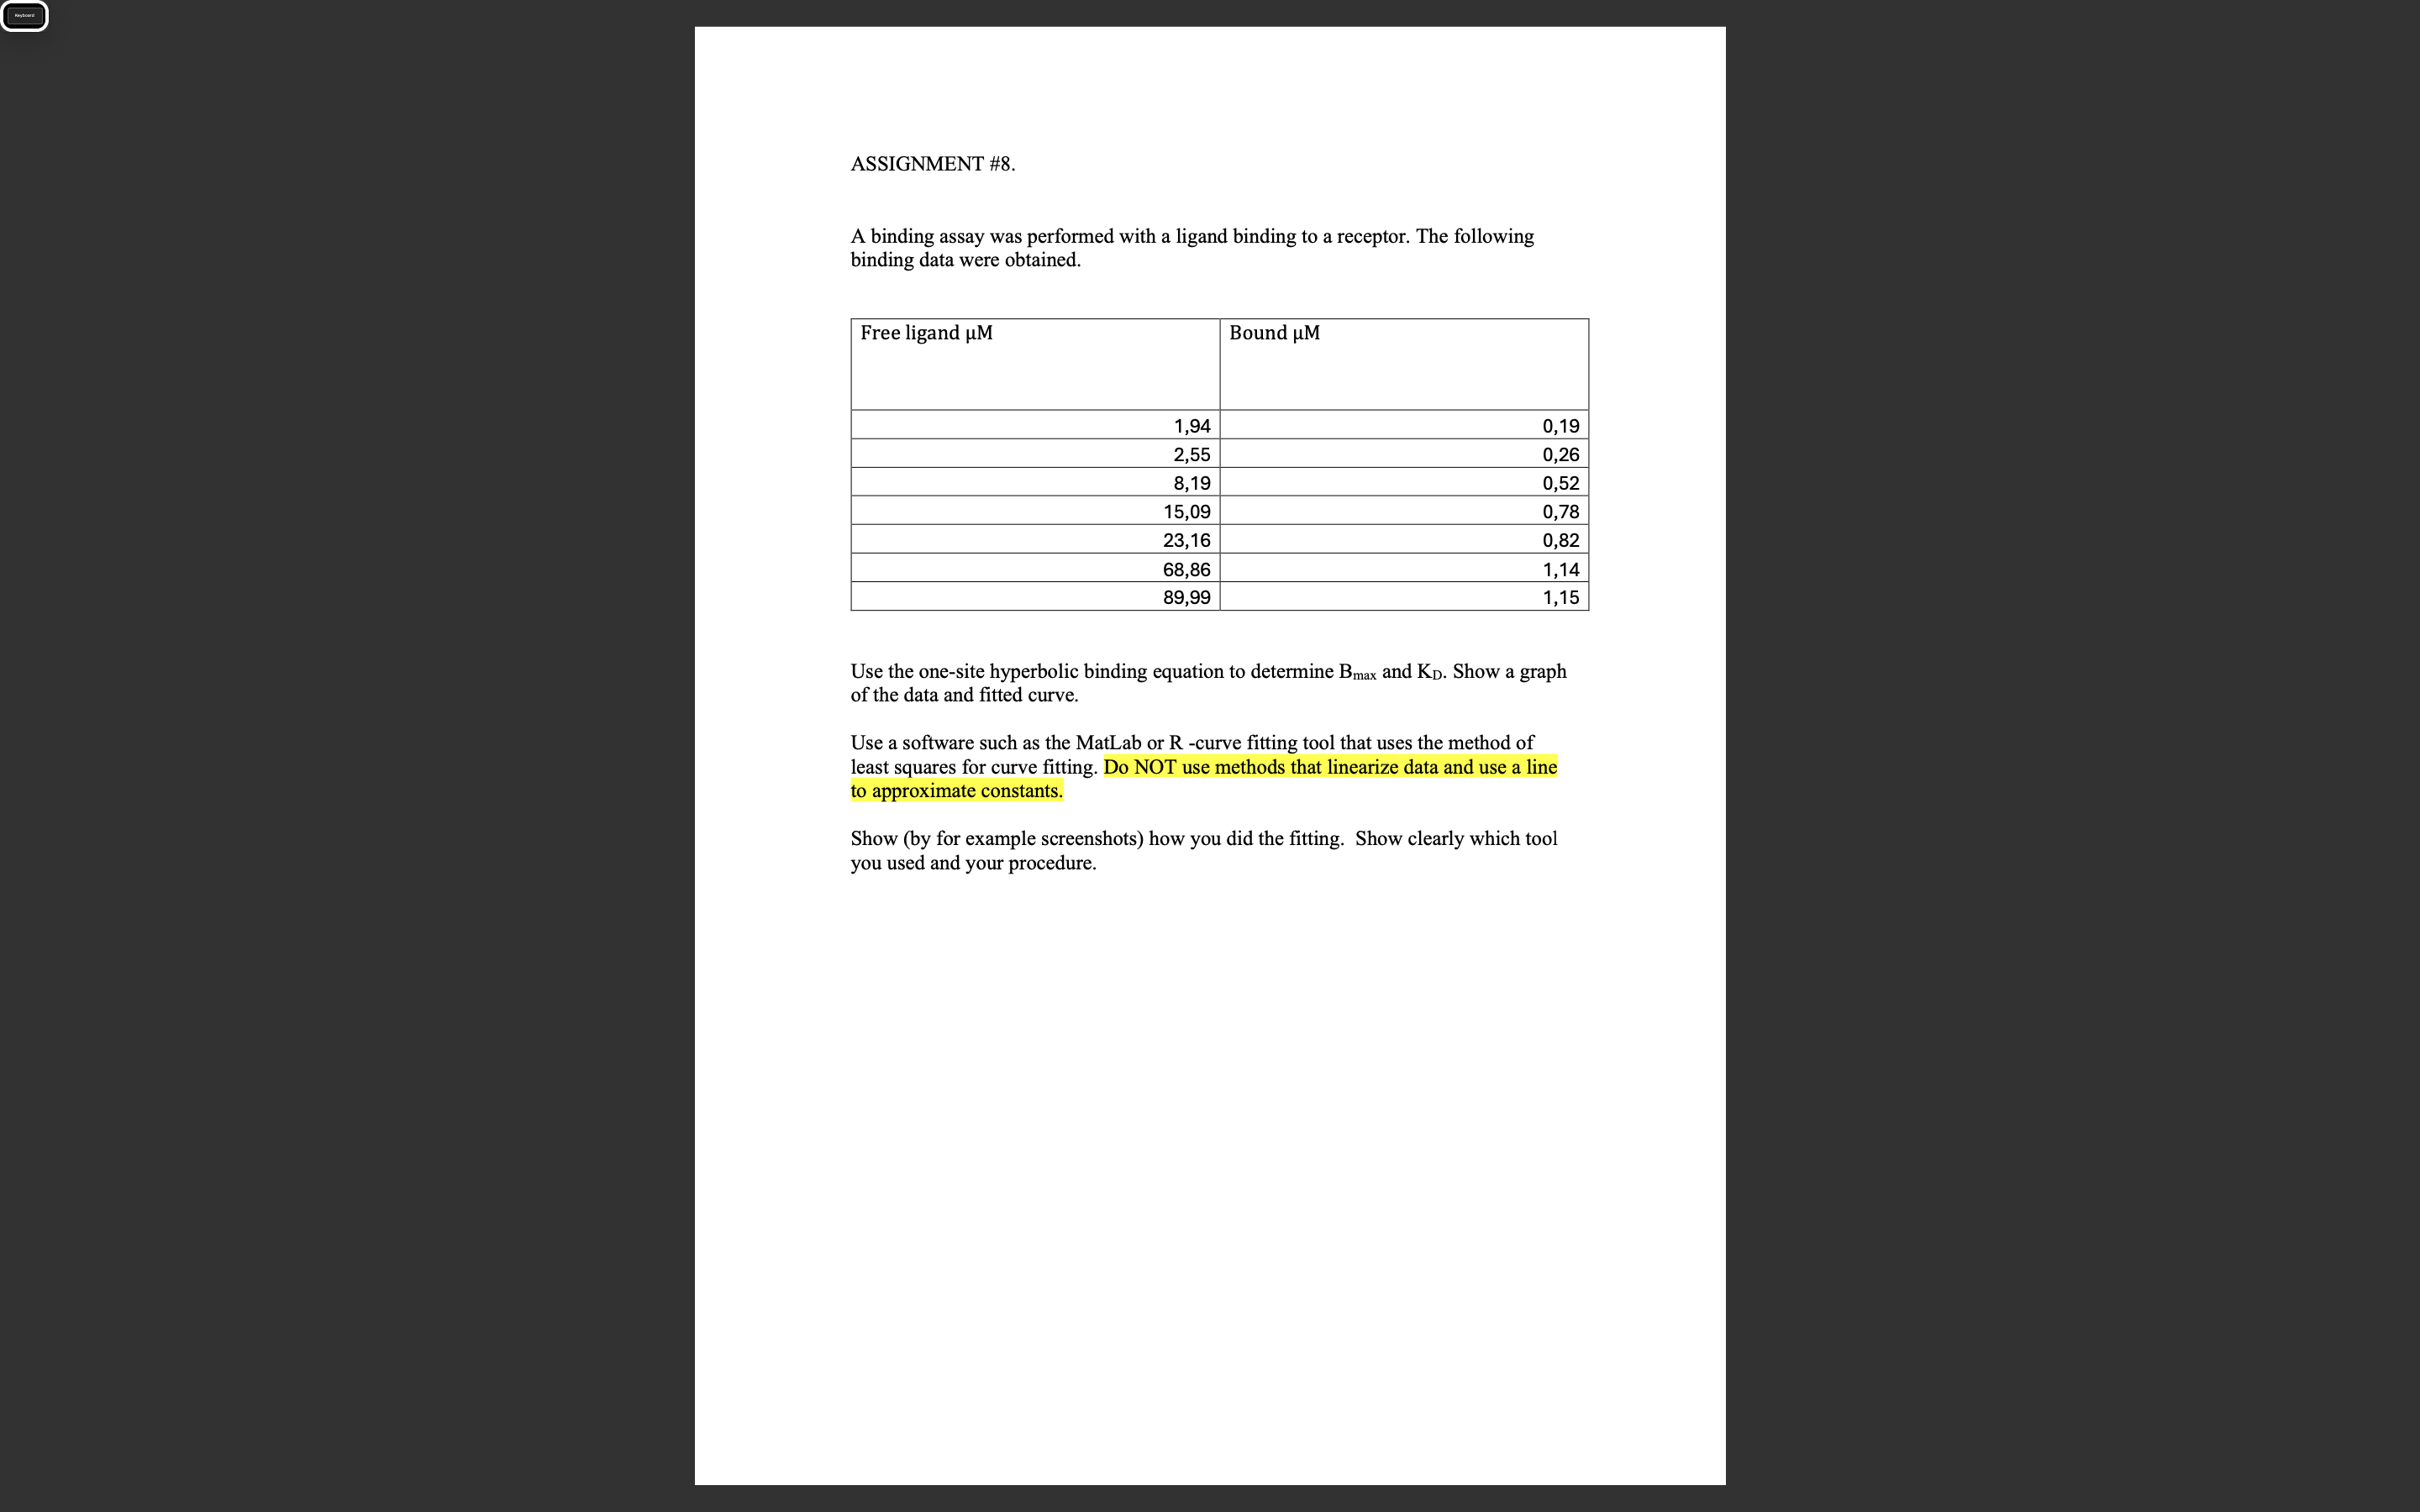
A binding assay was performed with a ligand binding to a receptor. The following binding data were obtained.
Use the onesite hyperbolic binding equation to determine Bmax and KD Show a graph of the data and fitted curve.
Use a software such as the MatLab or R curve fitting tool that uses the method of least squares for curve fitting. Do NOT use methods that linearize data and use a line to approximate constants.
Show by for example screenshots how you did the fitting. Show clearly which tool you used and your procedure.
Free ligand mu M
Bound mu MASSIGNMENT #
A binding assay was performed with a ligand binding to a receptor. The following binding data were obtained.
tableFree ligand Bound
Step by Step Solution
There are 3 Steps involved in it
1 Expert Approved Answer
Step: 1 Unlock

Question Has Been Solved by an Expert!
Get step-by-step solutions from verified subject matter experts
Step: 2 Unlock
Step: 3 Unlock