

Question: < Assignment 9 (16 Points) Learning Curve Analysis Example: 60% Learning Curve ACT 530-Assignment 9-re-Fall 2020 Name: (first name, middle name last name) #Units
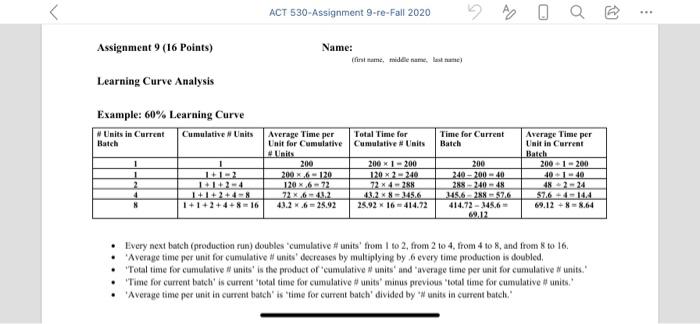
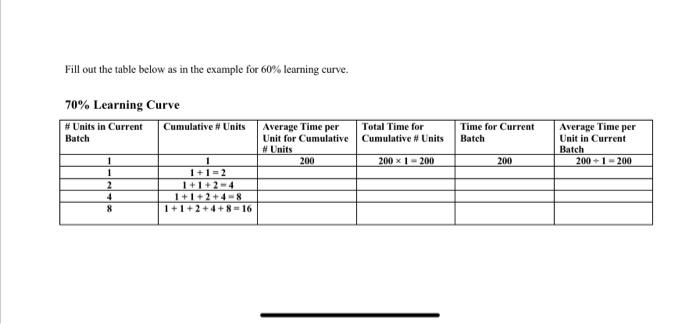
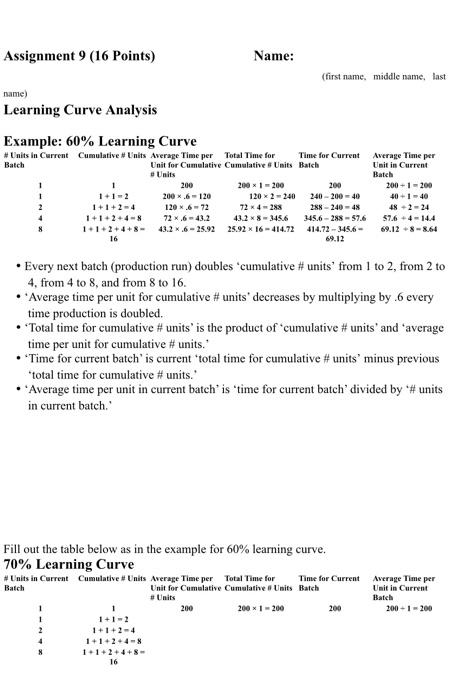
< Assignment 9 (16 Points) Learning Curve Analysis Example: 60% Learning Curve ACT 530-Assignment 9-re-Fall 2020 Name: (first name, middle name last name) #Units in Current Cumulative # Units Batch Average Time per Unit for Cumulative #Units Total Time for Cumulative # Units Time for Current Batch 1 1 2 1 1+1-2 1+1+2-4 200 2001-200 200 4 8 1+1+2+4-8 1+1+2+4+8-16 2006-120 1206-72 72x6-432 43.2.6-25.92 120x2-240 240-200-40 72x4-288 43.28-345.6 288-240-48 3456-288-57.6 Average Time per Unit in Current Batch 200-1-200 40-1-40 48-2-24 576-4-144. 25.92 16 414.72 414.72-345.6- 69.12 69.12 8 8.64 Every next batch (production run) doubles 'cumulative # units' from 1 to 2, from 2 to 4, from 4 to 8, and from 8 to 16. Average time per unit for cumulative # units' decreases by multiplying by .6 every time production is doubled. "Total time for cumulative # units" is the product of 'cumulative # units' and 'average time per unit for cumulative units." "Time for current batch' is current 'total time for cumulative # units' minus previous 'total time for cumulative # units." 'Average time per unit in current batch' is 'time for current batch' divided by "# units in current batch."
Step by Step Solution
There are 3 Steps involved in it

Get step-by-step solutions from verified subject matter experts