

Question: Assignment: Data Visualization PLS create appropriate excel charts based on data below to answer the following questions (one chart per question) : 1. What was
Assignment: Data Visualization
PLS create appropriate excel charts based on data below to answer the following questions (one chart per question) :
1. What was the number of men and women in the sample?
2. How do average movie ratings change with the age of the viewer? ( Hint: add a trendline for the average rating)
3. Do the ratings among men and women differ? ( Hint: compare trendlines for the average ratings among men and women)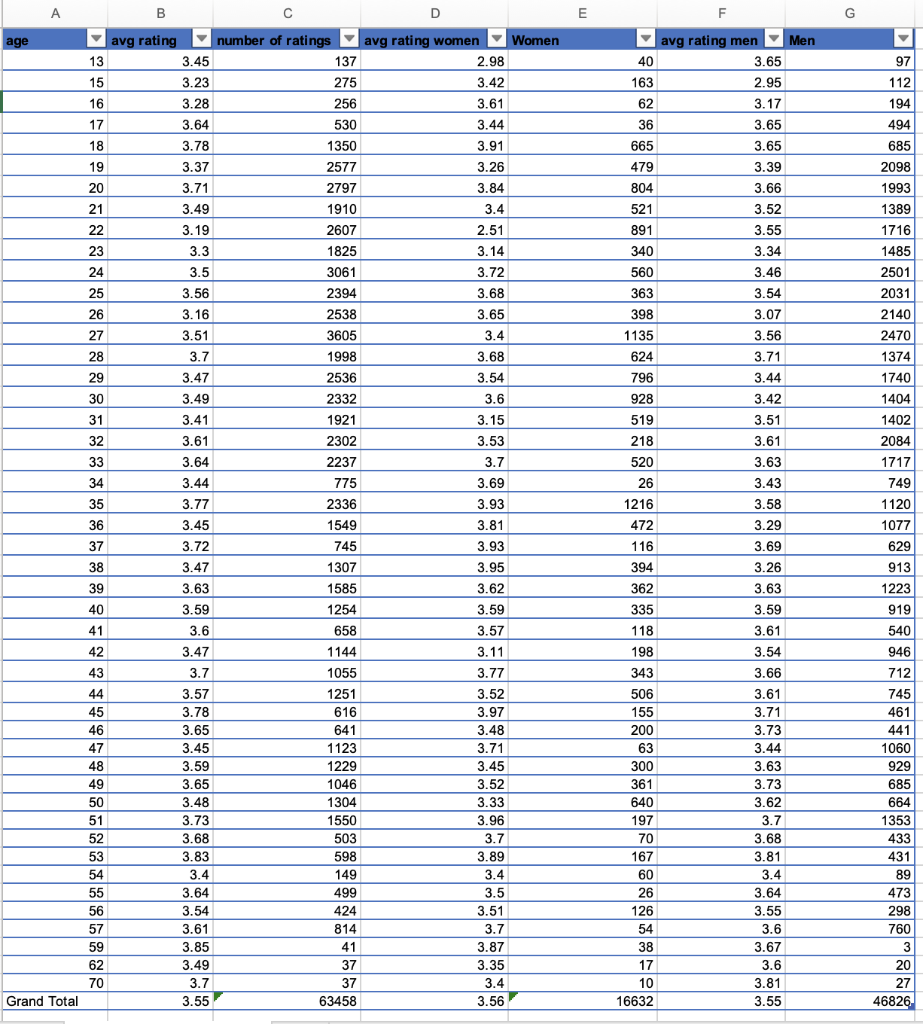
Step by Step Solution
There are 3 Steps involved in it
1 Expert Approved Answer
Step: 1 Unlock

Question Has Been Solved by an Expert!
Get step-by-step solutions from verified subject matter experts
Step: 2 Unlock
Step: 3 Unlock