

Question: Assignment Overview/ Problem Statement: The following assignment (Part A ) is intended to demonstrate how a spreadsheet application such as Microsoft Excel is used as
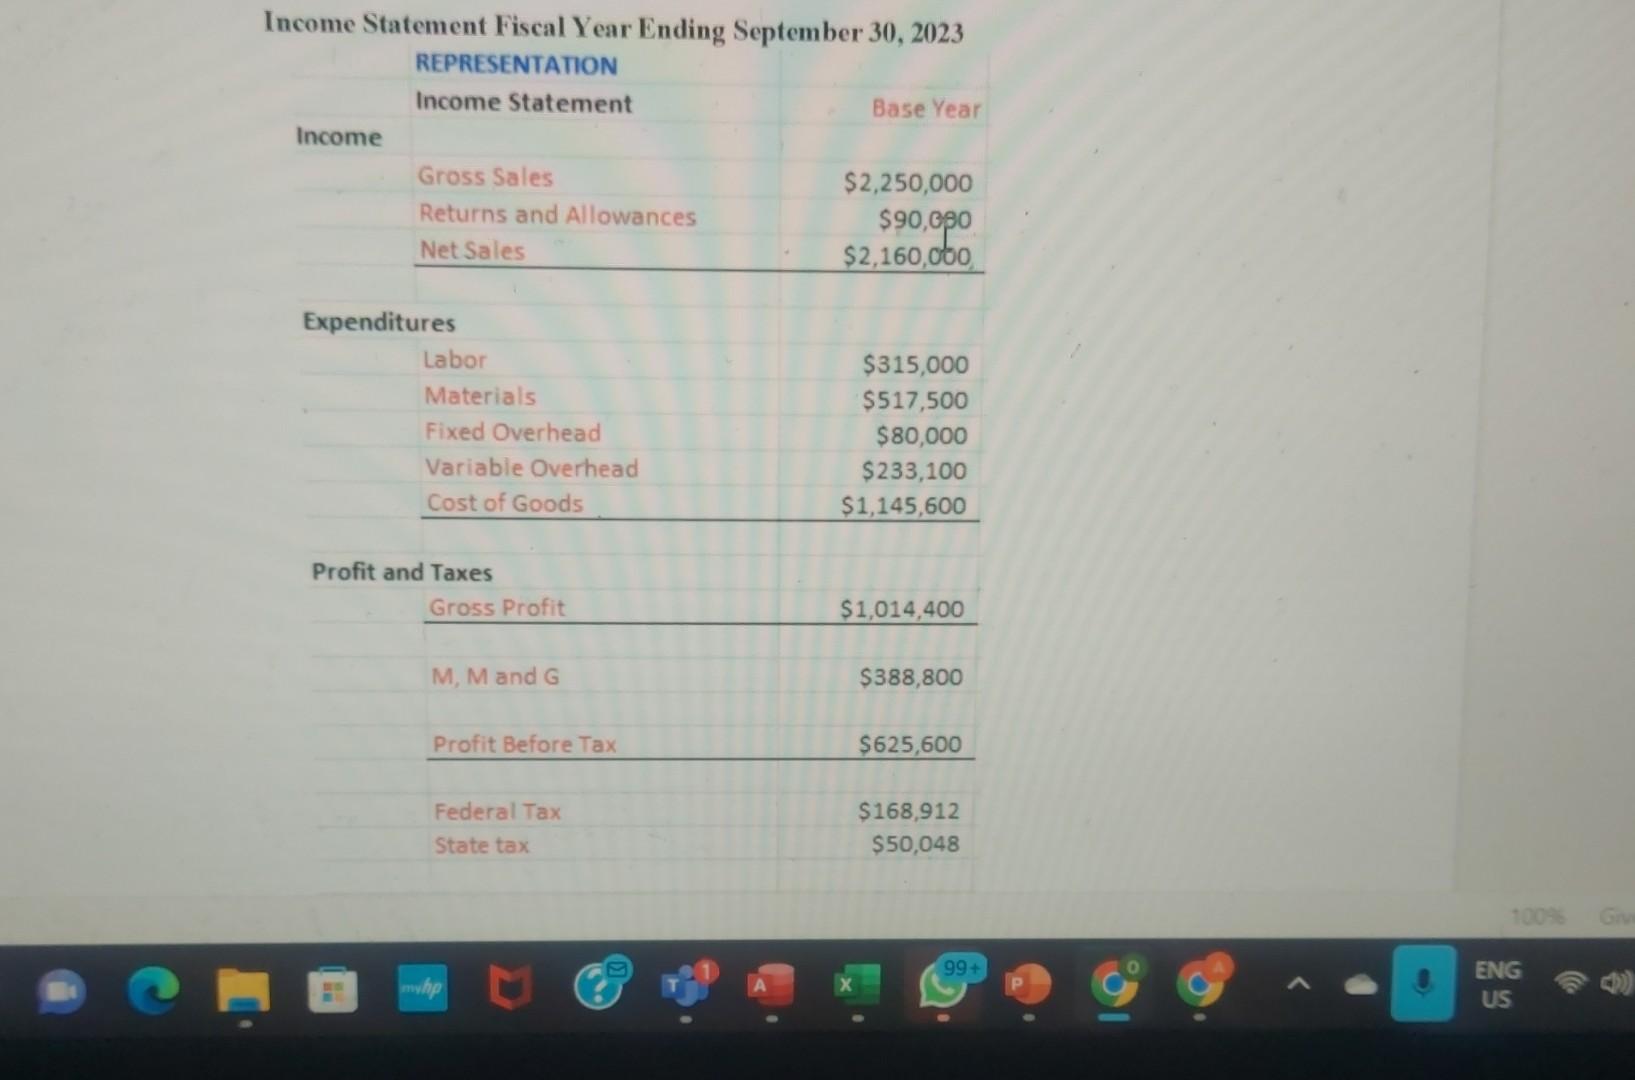

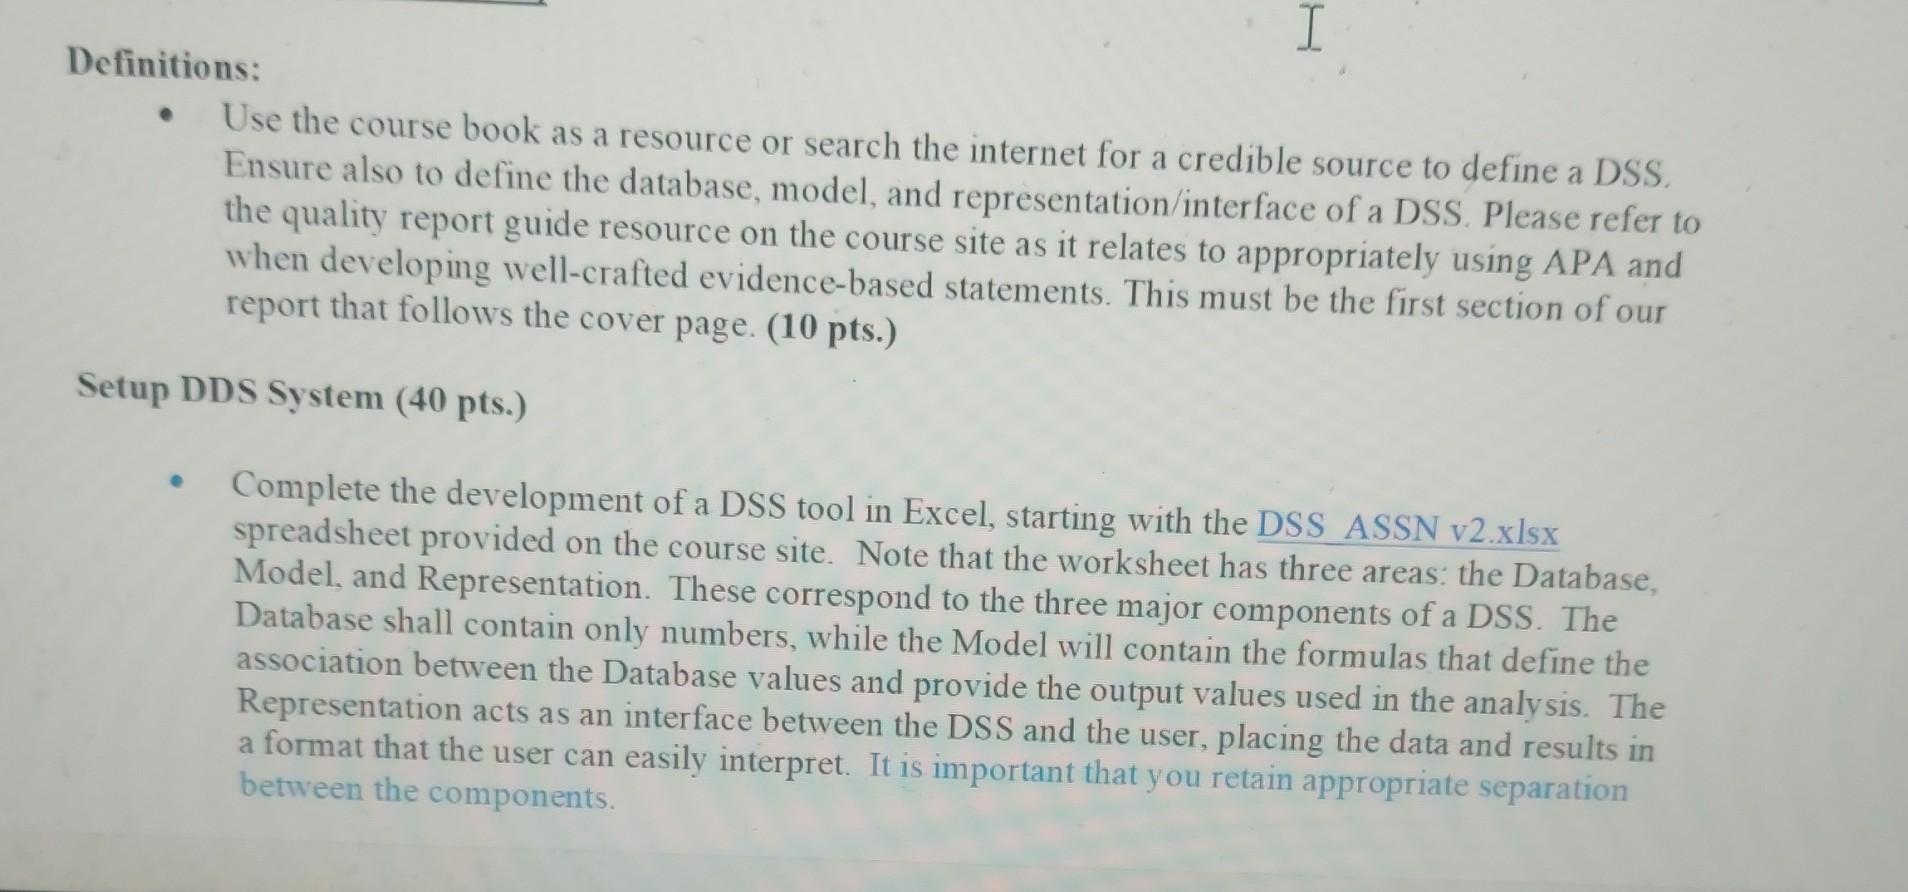
Assignment Overview/ Problem Statement: The following assignment (Part A ) is intended to demonstrate how a spreadsheet application such as Microsoft Excel is used as a Decision Support Tool for sensitivity analysis ("What if...?" analysis). You are to follow the instructions to complete and submit your solution. You will have to complete the DSS tool found on the course site. The Income Statement for FY2023 is shown betow, as are some descriptions of the relationships between data items contained in the Income Statement. You are to use this data and the descriptions to complete the Model of the DSS from the relationships described. Empty spaces are intentional as you are expected to develop respective formulas to compute and present in a well-formatted manner. Below is a sample extract from the DSS in the MS Excel file provided on the course site. A company produces and sells several products for gross sales (income) of 2.25 million dollars (for FY2023). Returns and allowances are 4 percent of gross sales, reducing the income for net sales. Marketing, management, and general expenses (MM\&G) are figured to be 18% of the net sales. Cost of goods sold is the sum of labor ( 14% of gross sales), materials (23\% of gross sales), and overhead. Overhead is figured to be variable overhead ( 28% of the combined cost of labor and materials) plus fixed overhead ($80,000). Gross profit is the difference between net sales and cost of goods sold. To figure the profit before tax, MM\&G expenses need to be subtracted from the gross profit. Finally, there are the 27% Federal taxes and 8% state taxes that need to be considered, but these are only assessed if there is indeed a profit; if the profit before tax is zero or below (a loss from operations), the tax is zero (Hint: you will need to use the IF function here). If included, then Net Income is equal to profit before tax - federal and sales tax. Page 1 of 4 Definitions: - Use the course book as a resource or search the internet for a credible source to define a DSS. Ensure also to define the database, model, and representation/interface of a DSS. Please refer to the quality report guide resource on the course site as it relates to appropriately using APA and when developing well-crafted evidence-based statements. This must be the first section of our report that follows the cover page. (10 pts.) Setup DDS System (40 pts.) - Complete the development of a DSS tool in Excel, starting with the DSS ASSN v2.xIsx spreadsheet provided on the course site. Note that the worksheet has three areas: the Database, Model, and Representation. These correspond to the three major components of a DSS. The Database shall contain only numbers, while the Model will contain the formulas that define the association between the Database values and provide the output values used in the analysis. The Representation acts as an interface between the DSS and the user, placing the data and results in a format that the user can easily interpret. It is important that you retain appropriate separation between the components
Step by Step Solution
There are 3 Steps involved in it

Get step-by-step solutions from verified subject matter experts