

Question: Assignment < Question 2 of 6 > Attempt 2 Use the Statistical Applet: Normal Density Curve to answer the question. Set the mean and
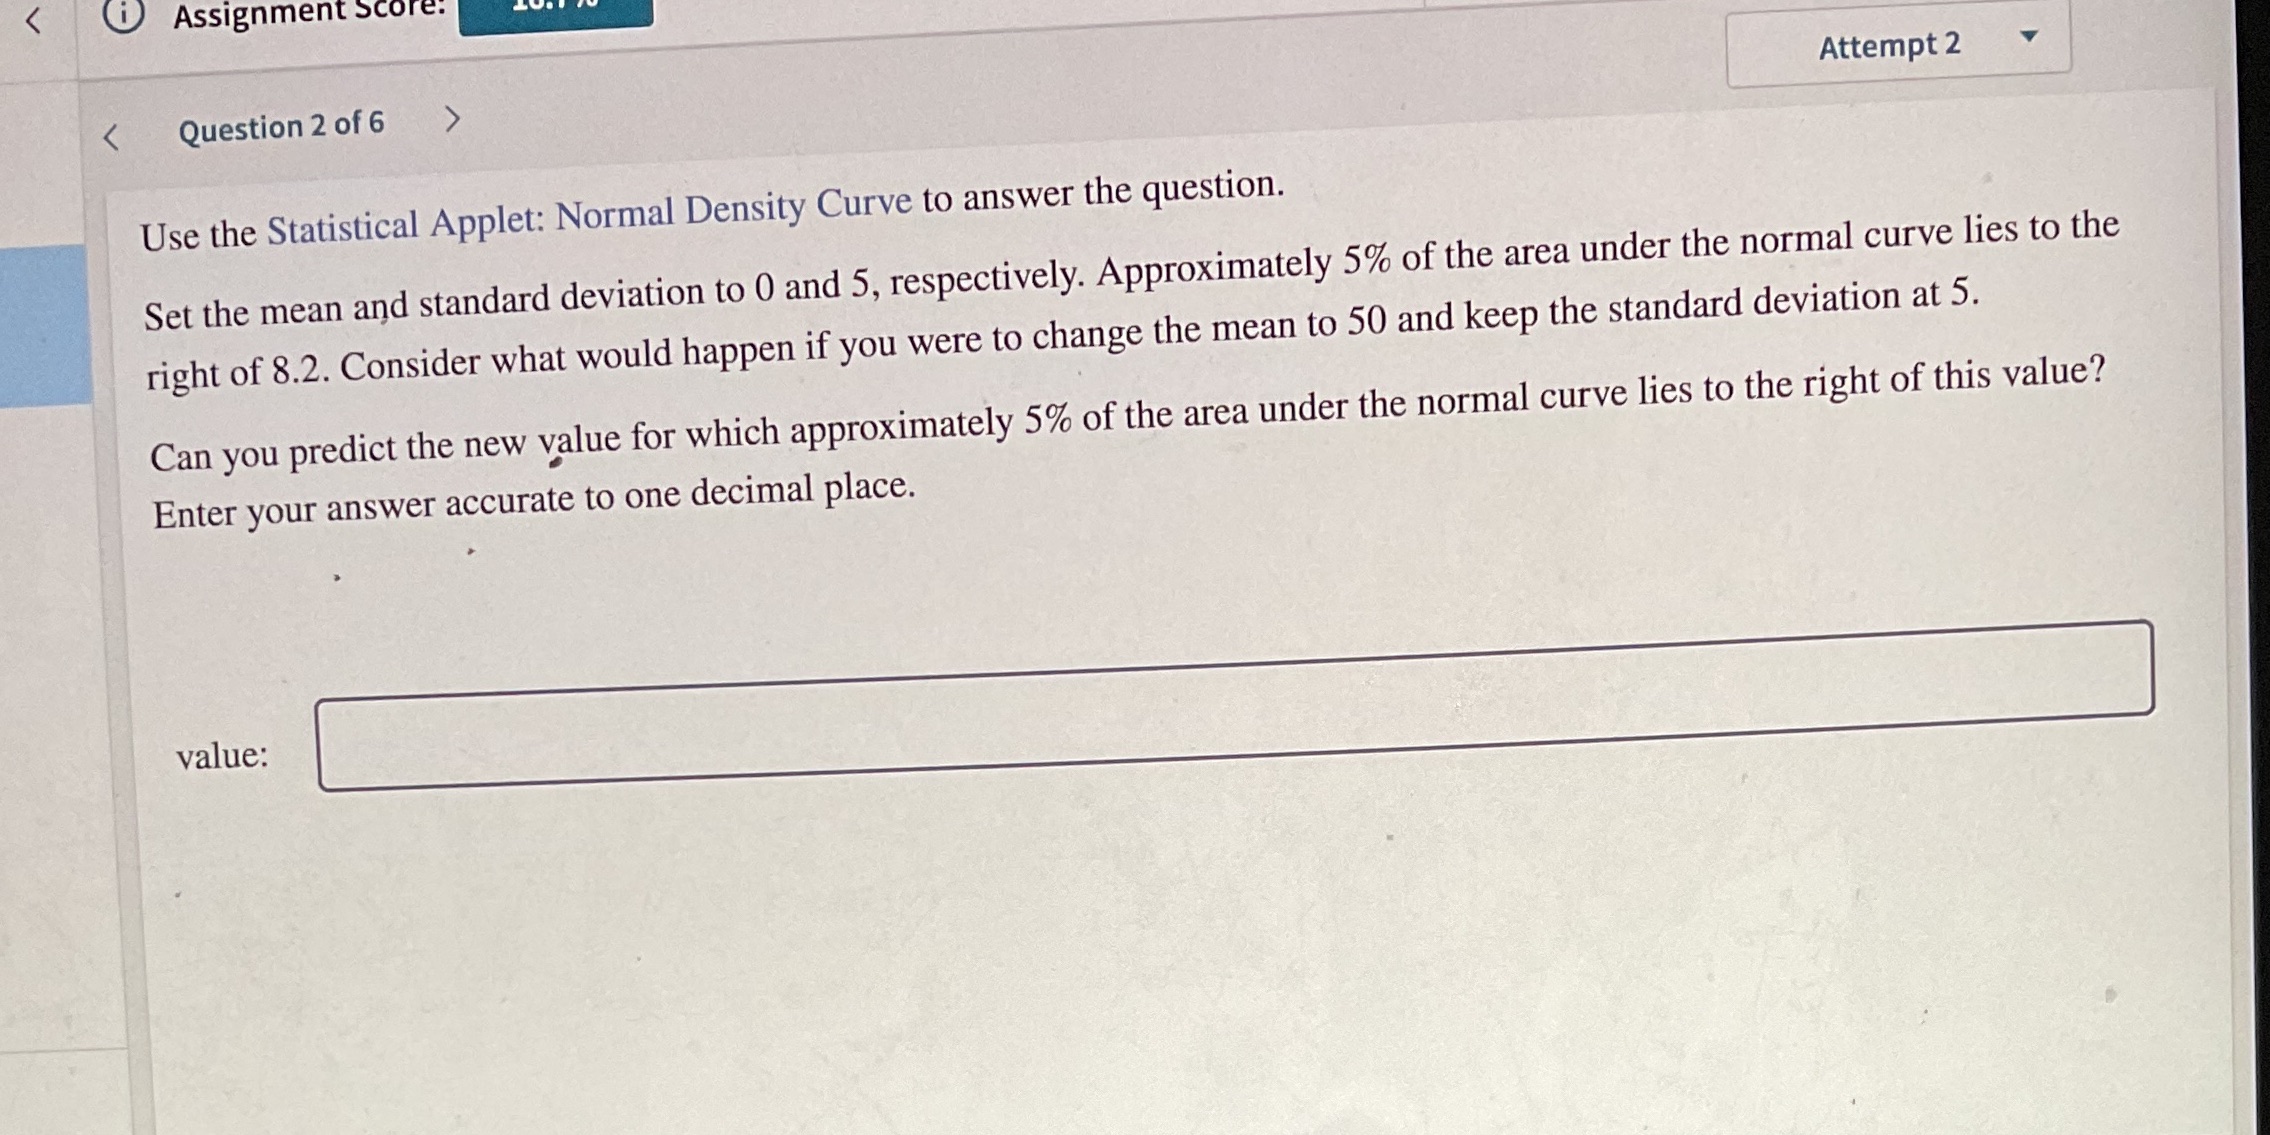
Assignment < Question 2 of 6 > Attempt 2 Use the Statistical Applet: Normal Density Curve to answer the question. Set the mean and standard deviation to 0 and 5, respectively. Approximately 5% of the area under the normal curve lies to the right of 8.2. Consider what would happen if you were to change the mean to 50 and keep the standard deviation at 5. Can you predict the new value for which approximately 5% of the area under the normal curve lies to the right of this value? Enter your answer accurate to one decimal place. value:
Step by Step Solution
There are 3 Steps involved in it
1 Expert Approved Answer
Step: 1 Unlock

Question Has Been Solved by an Expert!
Get step-by-step solutions from verified subject matter experts
Step: 2 Unlock
Step: 3 Unlock