

Question: Assignment Steps: 1. Download data file AT Data Job GP. 2. Double left-click on Tableau icon to open it. 3. Left-click on Microsoft Excel
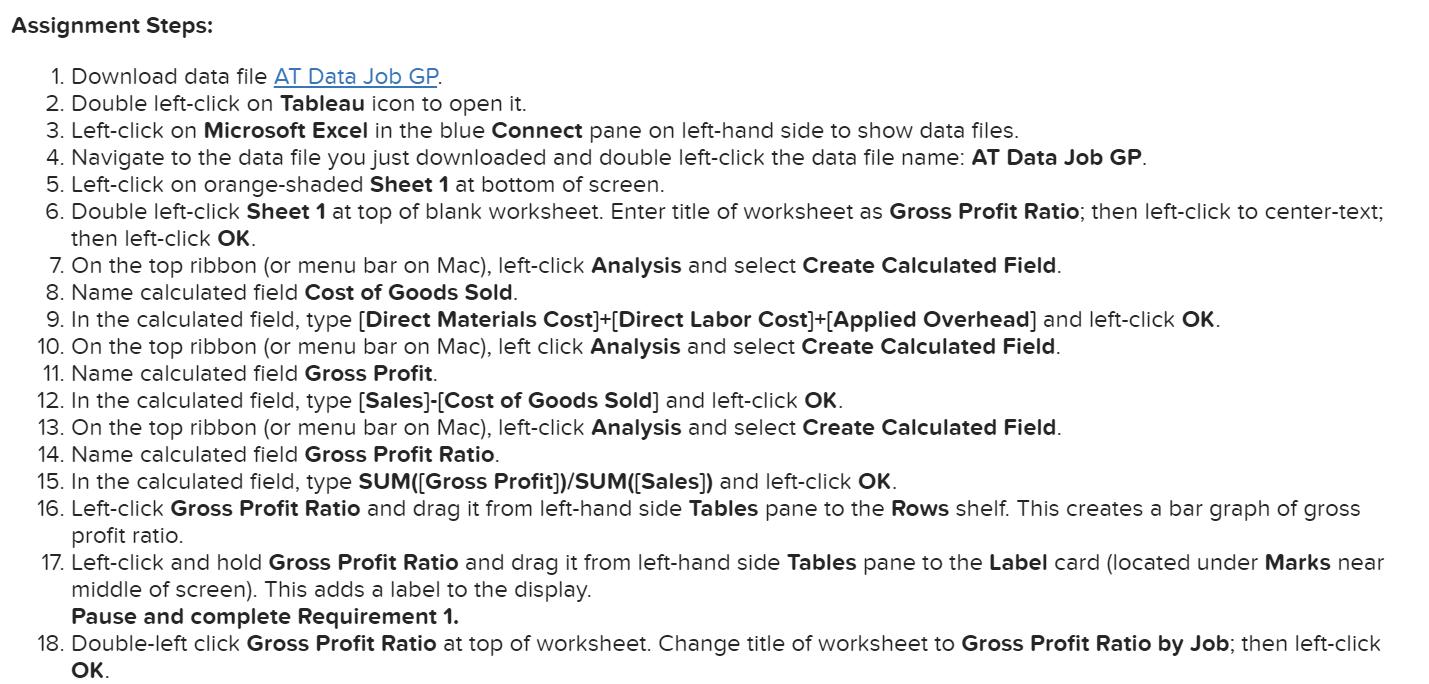
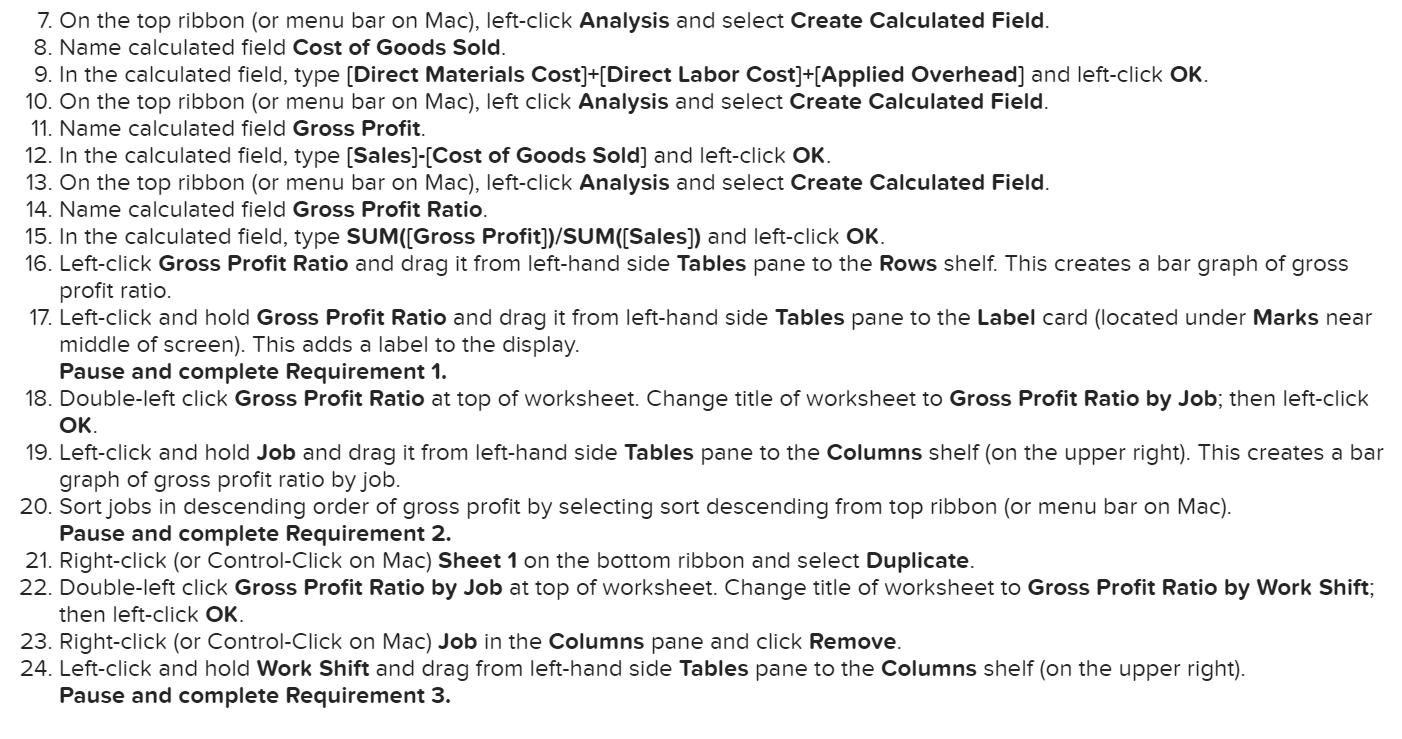
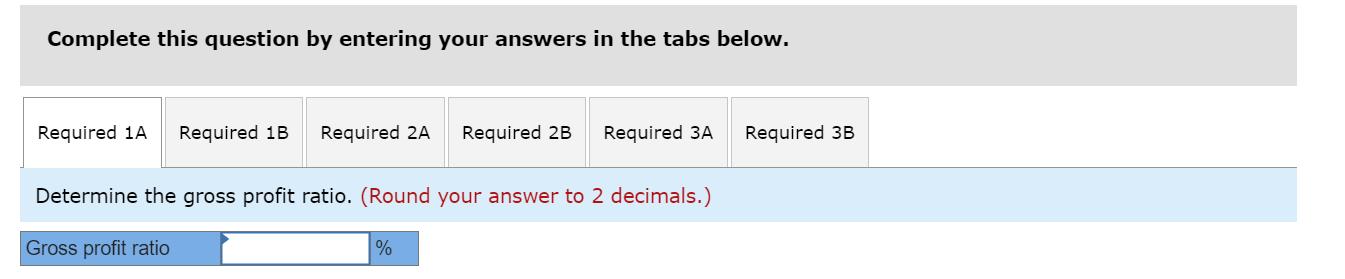
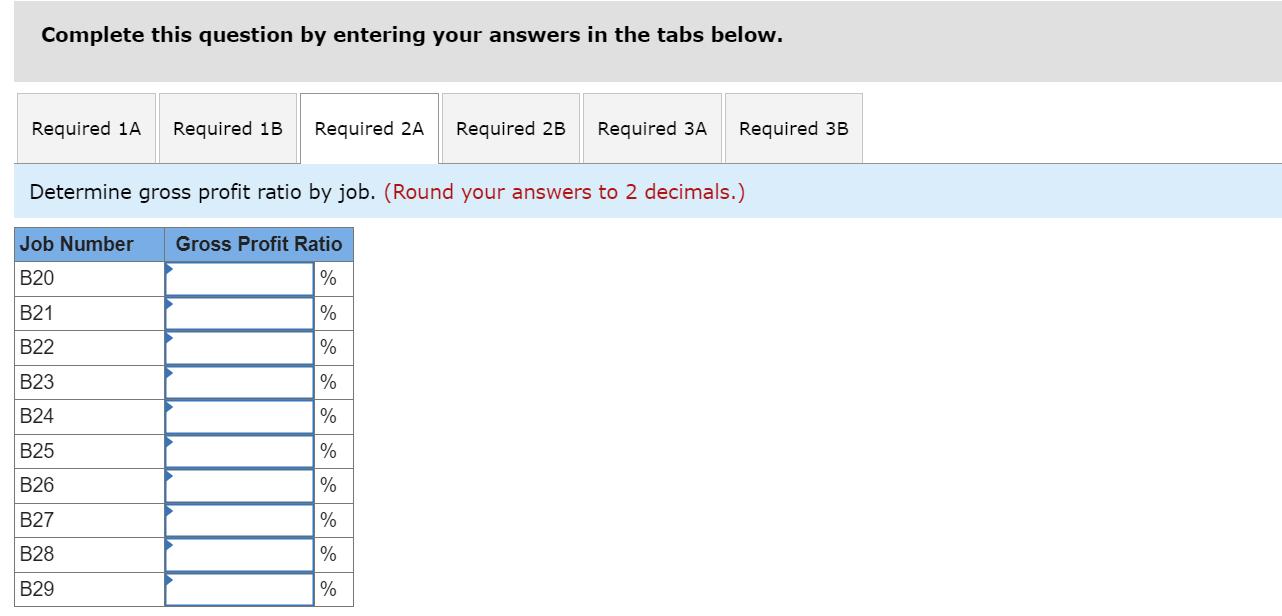
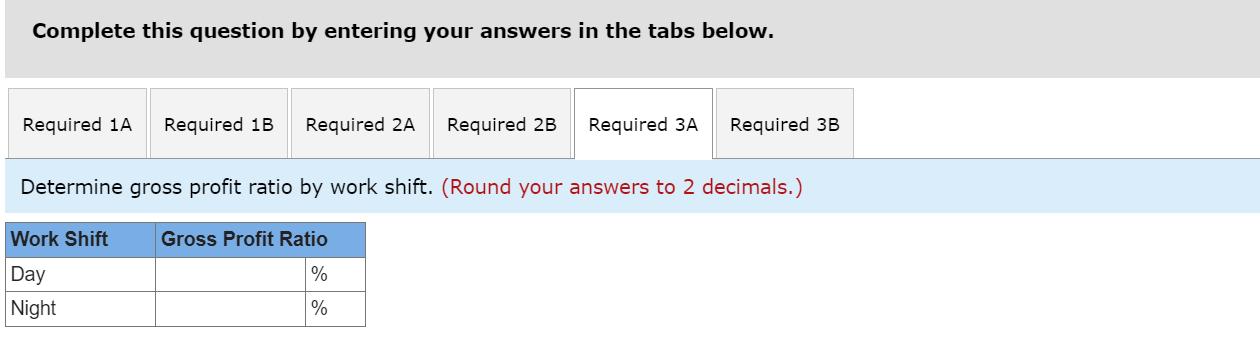
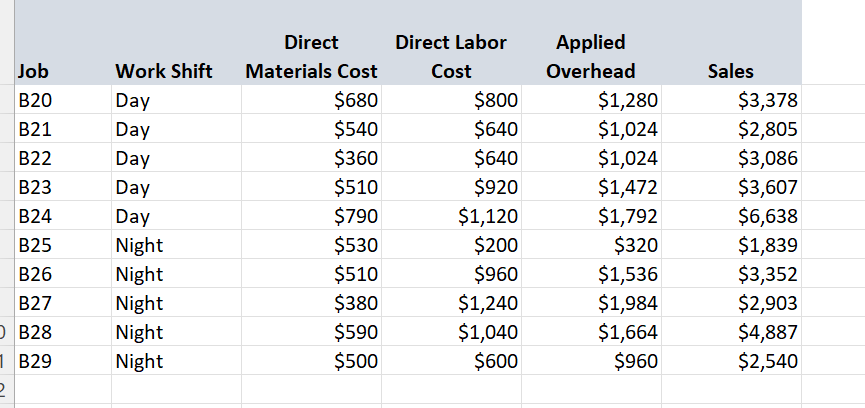
Assignment Steps: 1. Download data file AT Data Job GP. 2. Double left-click on Tableau icon to open it. 3. Left-click on Microsoft Excel in the blue Connect pane on left-hand side to show data files. 4. Navigate to the data file you just downloaded and double left-click the data file name: AT Data Job GP. 5. Left-click on orange-shaded Sheet 1 at bottom of screen. 6. Double left-click Sheet 1 at top of blank worksheet. Enter title of worksheet as Gross Profit Ratio; then left-click to center-text; then left-click OK. 7. On the top ribbon (or menu bar on Mac), left-click Analysis and select Create Calculated Field. 8. Name calculated field Cost of Goods Sold. 9. In the calculated field, type [Direct Materials Cost]+[Direct Labor Cost]+[Applied Overhead] and left-click OK. 10. On the top ribbon (or menu bar on Mac), left click Analysis and select Create Calculated Field. 11. Name calculated field Gross Profit. 12. In the calculated field, type [Sales]-[Cost of Goods Sold] and left-click OK. 13. On the top ribbon (or menu bar on Mac), left-click Analysis and select Create Calculated Field. 14. Name calculated field Gross Profit Ratio. 15. In the calculated field, type SUM([Gross Profit])/SUM([Sales]) and left-click OK. 16. Left-click Gross Profit Ratio and drag it from left-hand side Tables pane to the Rows shelf. This creates a bar graph of gross profit ratio. 17. Left-click and hold Gross Profit Ratio and drag it from left-hand side Tables pane to the Label card (located under Marks near middle of screen). This adds a label to the display. Pause and complete Requirement 1. 18. Double-left click Gross Profit Ratio at top of worksheet. Change title of worksheet to Gross Profit Ratio by Job; then left-click OK. 7. On the top ribbon (or menu bar on Mac), left-click Analysis and select Create Calculated Field. 8. Name calculated field Cost of Goods Sold. 9. In the calculated field, type [Direct Materials Cost]+[Direct Labor Cost]+[Applied Overhead] and left-click OK. 10. On the top ribbon (or menu bar on Mac), left click Analysis and select Create Calculated Field. 11. Name calculated field Gross Profit. 12. In the calculated field, type [Sales]-[Cost of Goods Sold] and left-click OK. 13. On the top ribbon (or menu bar on Mac), left-click Analysis and select Create Calculated Field. 14. Name calculated field Gross Profit Ratio. 15. In the calculated field, type SUM([Gross Profit])/SUM([Sales]) and left-click OK. 16. Left-click Gross Profit Ratio and drag it from left-hand side Tables pane to the Rows shelf. This creates a bar graph of gross profit ratio. 17. Left-click and hold Gross Profit Ratio and drag it from left-hand side Tables pane to the Label card (located under Marks near middle of screen). This adds a label to the display. Pause and complete Requirement 1. 18. Double-left click Gross Profit Ratio at top of worksheet. Change title of worksheet to Gross Profit Ratio by Job; then left-click OK. 19. Left-click and hold Job and drag it from left-hand side Tables pane to the Columns shelf (on the upper right). This creates a bar graph of gross profit ratio by job. 20. Sort jobs in descending order of gross profit by selecting sort descending from top ribbon (or menu bar on Mac). Pause and complete Requirement 2. 21. Right-click (or Control-Click on Mac) Sheet 1 on the bottom ribbon and select Duplicate. 22. Double-left click Gross Profit Ratio by Job at top of worksheet. Change title of worksheet to Gross Profit Ratio by Work Shift; then left-click OK. 23. Right-click (or Control-Click on Mac) Job in the Columns pane and click Remove. 24. Left-click and hold Work Shift and drag from left-hand side Tables pane to the Columns shelf (on the upper right). Pause and complete Requirement 3. Complete this question by entering your answers in the tabs below. Required 1A Required 1B Required 2A Required 2B Required 3A Determine the gross profit ratio. (Round your answer to 2 decimals.) Gross profit ratio % Required 3B Complete this question by entering your answers in the tabs below. Required 1A Required 1B Required 2A Required 2B Required 3A Required 3B Determine gross profit ratio by job. (Round your answers to 2 decimals.) Job Number Gross Profit Ratio B20 % % % B21 B22 B23 B24 B25 B26 B27 B28 B29 % % % % % % % Complete this question by entering your answers in the tabs below. Required 1A Required 1B Required 2A Required 2B Required 3A Required 3B Determine gross profit ratio by work shift. (Round your answers to 2 decimals.) Gross Profit Ratio % % Work Shift Day Night Job B20 B21 B22 B23 B24 B25 B26 B27 D B28 1 B29 2 Work Shift Day Day Day Day Day Night Night Night Night Night Direct Materials Cost $680 $540 $360 $510 $790 $530 $510 $380 $590 $500 Direct Labor Cost $800 $640 $640 $920 $1,120 $200 $960 $1,240 $1,040 $600 Applied Overhead $1,280 $1,024 $1,024 $1,472 $1,792 $320 $1,536 $1,984 $1,664 $960 Sales $3,378 $2,805 $3,086 $3,607 $6,638 $1,839 $3,352 $2,903 $4,887 $2,540
Step by Step Solution
3.45 Rating (155 Votes )
There are 3 Steps involved in it
Here are the stepbystep workings 1 Gross Profit Ratio Create Cost of G... View full answer

Get step-by-step solutions from verified subject matter experts