

Question: The client has provided you with the calculations below, and asked you to determine whether an investment in sector (X) is a profitable investment.
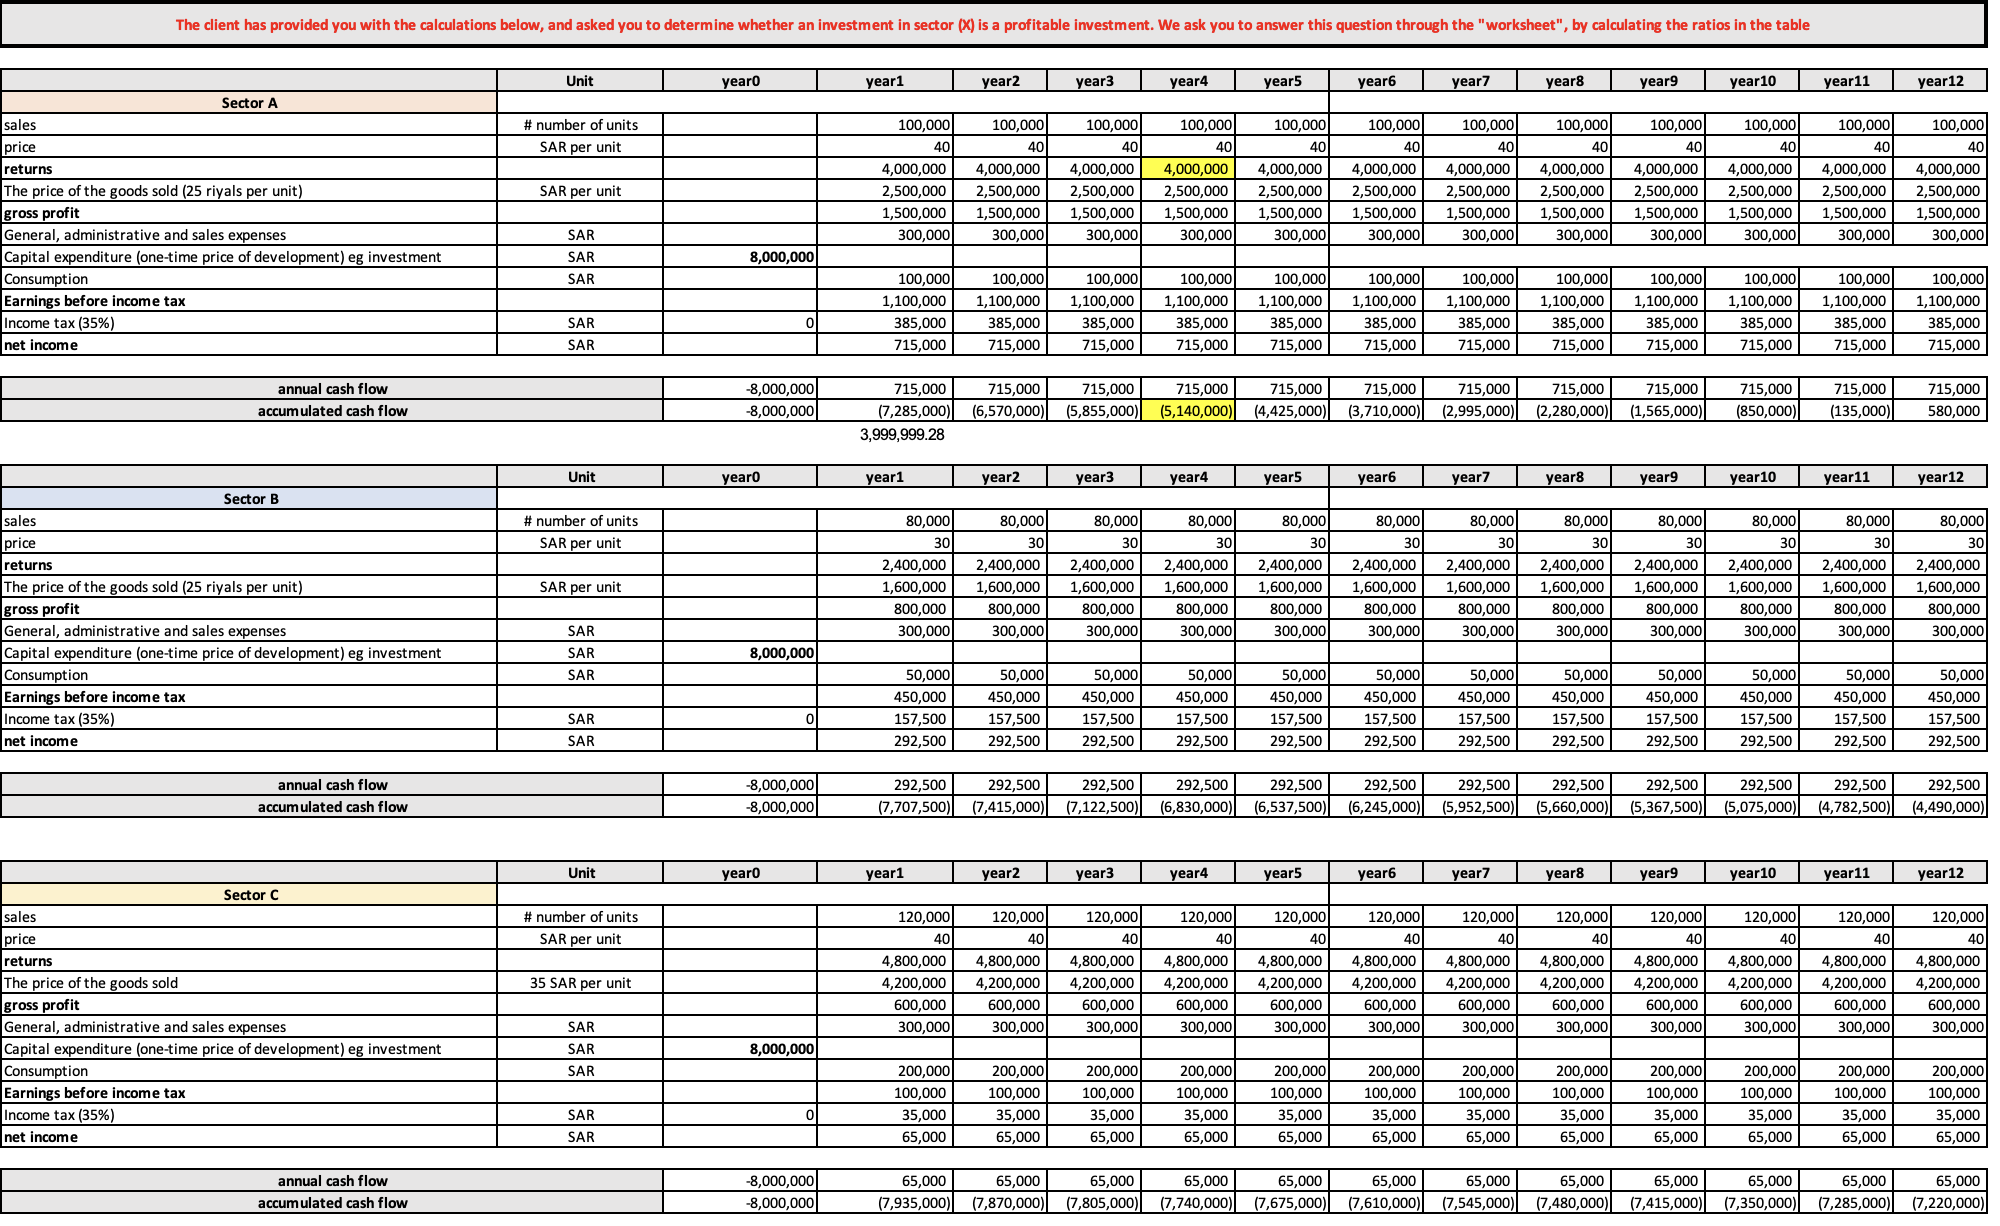
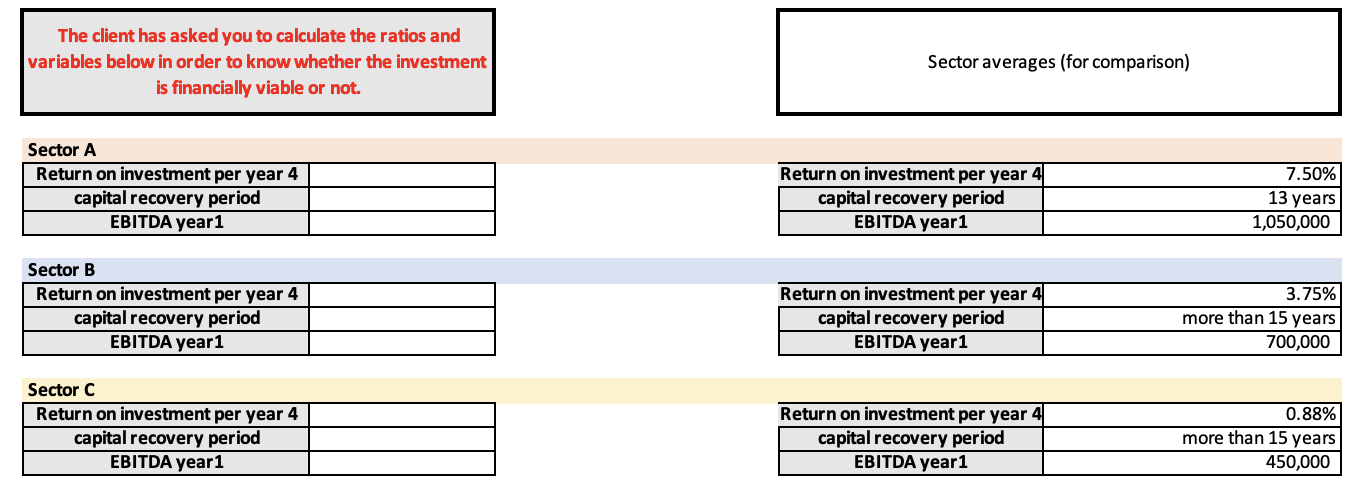
The client has provided you with the calculations below, and asked you to determine whether an investment in sector (X) is a profitable investment. We ask you to answer this question through the "worksheet", by calculating the ratios in the table Sector A sales price returns The price of the goods sold (25 riyals per unit) gross profit General, administrative and sales expenses Capital expenditure (one-time price of development) eg investment Consumption Earnings before income tax Income tax (35%) net income sales price returns annual cash flow accumulated cash flow Sector B sales price returns The price of the goods sold (25 riyals per unit) gross profit General, administrative and sales expenses Capital expenditure (one-time price of development) eg investment Consumption Earnings before income tax Income tax (35%) net income annual cash flow accumulated cash flow Sector C The price of the goods sold gross profit General, administrative and sales expenses Capital expenditure (one-time price of development) eg investment Consumption Earnings before income tax Income tax (35%) net income annual cash flow accumulated cash flow Unit # number of units SAR per unit SAR per unit SAR SAR SAR SAR SAR Unit # number of units SAR per unit SAR per unit SAR SAR SAR SAR SAR Unit # number of units SAR per unit 35 SAR per unit SAR SAR SAR SAR SAR year0 8,000,000 -8,000,000 -8,000,000 year0 0 8,000,000 year0 0 -8,000,000 -8,000,000 8,000,000 0 -8,000,000 -8,000,000 year1 100,000 40 year1 100,000 100,000 100,000 1,100,000 1,100,000 1,100,000 385,000 385,000 385,000 715,000 715,000 715,000 80,000 30 year2 50,000 450,000 157,500 292,500 100,000 40 ear1 4,000,000 4,000,000 4,000,000 4,000,000 4,000,000 2,500,000 2,500,000 2,500,000 2,500,000 2,500,000 1,500,000 1,500,000 1,500,000 1,500,000 1,500,000 300,000 300,000 300,000 300,000 300,000 120,000 40 year2 200,000 100,000 35,000 65,000 80,000 30 year3 100,000 40 715,000 715,000 715,000 715,000 715,000 715,000 (7,285,000) (6,570,000) (5,855,000) (5,140,000) (4,425,000) (3,710,000) 3,999,999.28 50,000 450,000 157,500 292,500 120,000 40 292,500 292,500 292,500 (7,707,500) (7,415,000) (7,122,500) year3 200,000 100,000 35,000 65,000 80,000 30 50,000 450,000 157,500 292,500 4,800,000 4,800,000 4,800,000 4,200,000 4,200,000 4,200,000 600,000 600,000 600,000 300,000 300,000 300,000 year4 120,000 40 100,000 40 200,000 100,000 35,000 65,000 year4 80,000 30 year5 100,000 40 100,000 100,000 100,000 1,100,000 1,100,000 1,100,000 385,000 385,000 385,000 715,000 715,000 715,000 50,000 450,000 157,500 292,500 120,000 40 year5 200,000 100,000 35,000 65,000 80,000 30 50,000 450,000 157,500 292,500 year5 year6 120,000 100,000 40 40 200,000 100,000 35,000 65,000 65,000 65,000 65,000 65,000 65,000 (7,935,000) (7,870,000) (7,805,000) (7,740,000) (7,675,000) year6 80,000 30 50,000 450,000 157,500 292,500 292,500 292,500 292,500 292,500 (6,830,000) (6,537,500) (6,245,000) (5,952,500) year7 year6 100,000 40 120,000 40 100,000 1,100,000 385,000 715,000 200,000 100,000 35,000 65,000 4,000,000 4,000,000 4,000,000 4,000,000 4,000,000 4,000,000 4,000,000 2,500,000 2,500,000 2,500,000 2,500,000 2,500,000 2,500,000 2,500,000 1,500,000 1,500,000 1,500,000 1,500,000 1,500,000 1,500,000 1,500,000 300,000 300,000 300,000 300,000 300,000 300,000 300,000 year7 2,400,000 2,400,000 2,400,000 2,400,000 2,400,000 2,400,000 2,400,000 2,400,000 2,400,000 2,400,000 2,400,000 2,400,000 1,600,000 1,600,000 1,600,000 1,600,000 1,600,000 1,600,000 1,600,000 1,600,000 1,600,000 1,600,000 1,600,000 1,600,000 800,000 800,000 800,000 800,000 300,000 300,000 300,000 800,000 300,000 800,000 300,000 800,000 300,000 800,000 300,000 800,000 300,000 800,000 300,000 800,000 300,000 800,000 300,000 300,000 80,000 30 50,000 450,000 157,500 292,500 year8 year7 100,000 40 120,000 40 100,000 1,100,000 385,000 715,000 200,000 100,000 35,000 65,000 715,000 715,000 715,000 715,000 715,000 (2,995,000) (2,280,000) (1,565,000) (850,000) (135,000) year8 80,000 30 50,000 450,000 157,500 292,500 year9 100,000 40 ear8 120,000 40 200,000 100,000 35,000 65,000 year9 80,000 30 year10 50,000 450,000 157,500 292,500 100,000 40 100,000 100,000 100,000 100,000 1,100,000 1,100,000 1,100,000 1,100,000 385,000 385,000 385,000 385,000 715,000 715,000 715,000 715,000 ar9 120,000 40 year10 200,000 100,000 35,000 65,000 80,000 30 year11 50,000 450,000 157,500 292,500 292,500 292,500 292,500 292,500 (5,660,000) (5,367,500) (5,075,000) (4,782,500) 100,000 40 year10 120,000 40 year11 200,000 100,000 35,000 65,000 80,000 30 50,000 450,000 157,500 292,500 year12 ar11 100,000 40 120,000 40 4,800,000 4,800,000 4,800,000 4,800,000 4,800,000 4,800,000 4,800,000 4,800,000 4,800,000 4,200,000 4,200,000 4,200,000 4,200,000 4,200,000 4,200,000 4,200,000 600,000 600,000 600,000 600,000 600,000 300,000 4,200,000 4,200,000 600,000 600,000 600,000 300,000 600,000 300,000 300,000 300,000 300,000 300,000 300,000 300,000 200,000 100,000 35,000 65,000 715,000 580,000 year12 80,000 30 50,000 450,000 157,500 292,500 292,500 (4,490,000) ar12 120,000 40 200,000 100,000 35,000 65,000 65,000 65,000 65,000 65,000 65,000 65,000 65,000 (7,610,000) (7,545,000) (7,480,000) (7,415,000)| (7,350,000) (7,285,000) (7,220,000) The client has asked you to calculate the ratios and variables below in order to know whether the investment is financially viable or not. Sector A Return on investment per year 4 capital recovery period EBITDA year1 Sector B Return on investment per year 4 capital recovery period EBITDA year1 Sector C Return on investment per year 4 capital recovery period EBITDA year1 Sector averages (for comparison) Return on investment per year 4 capital recovery period EBITDA year1 Return on investment per year 4 capital recovery period EBITDA year1 Return on investment per year 4 capital recovery period EBITDA year1 7.50% 13 years 1,050,000 3.75% more than 15 years 700,000 0.88% more than 15 years 450,000
Step by Step Solution
There are 3 Steps involved in it
Profitability Analysis of Investment in Sector 00 Based on the provided information lets analyze the profitability of an investment in Sector 00 compa... View full answer

Get step-by-step solutions from verified subject matter experts