

Question: Assignment structure and task: 1. Introduction-Introduce the business problems. (10 marks) i. Describe the main objective of the researchers who collected this dataset (3 marks)
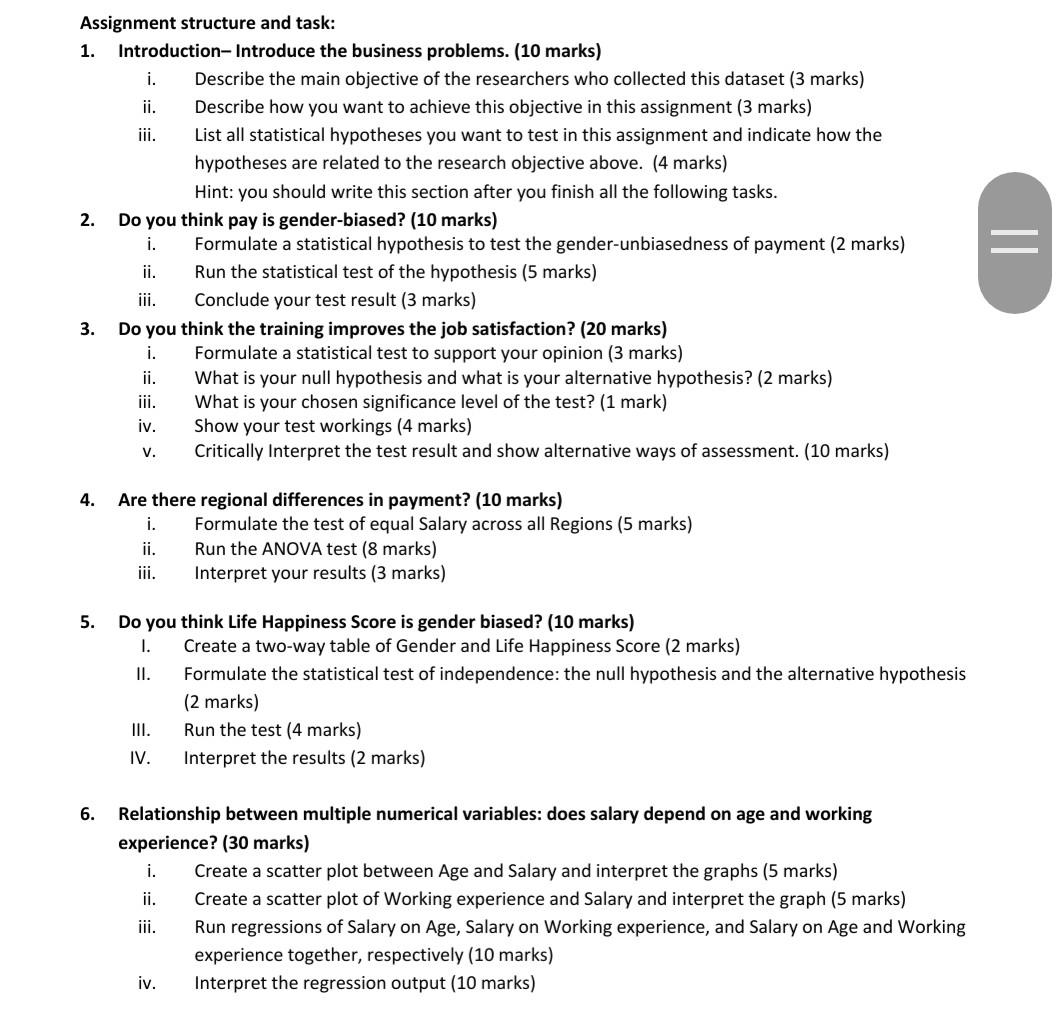
Assignment structure and task: 1. Introduction-Introduce the business problems. (10 marks) i. Describe the main objective of the researchers who collected this dataset (3 marks) ii. Describe how you want to achieve this objective in this assignment (3 marks) iii. List all statistical hypotheses you want to test in this assignment and indicate how the hypotheses are related to the research objective above. (4 marks) Hint: you should write this section after you finish all the following tasks. 2. Do you think pay is gender-biased? (10 marks) i. Formulate a statistical hypothesis to test the gender-unbiasedness of payment (2 marks) ii. Run the statistical test of the hypothesis (5 marks) iii. Conclude your test result (3 marks) 3. Do you think the training improves the job satisfaction? (20 marks) i. Formulate a statistical test to support your opinion (3 marks) ii. What is your null hypothesis and what is your alternative hypothesis? (2 marks) iii. What is your chosen significance level of the test? (1 mark) iv. Show your test workings (4 marks) Critically Interpret the test result and show alternative ways of assessment. (10 marks) V. 4. Are there regional differences in payment? (10 marks) i. Formulate the test of equal Salary across all Regions (5 marks) ii. Run the ANOVA test (8 marks) iii. Interpret your results (3 marks) 5. Do you think Life Happiness Score is gender biased? (10 marks) 1. Create a two-way table of Gender and Life Happiness Score (2 marks) II. Formulate the statistical test of independence: the null hypothesis and the alternative hypothesis (2 marks) III. Run the test (4 marks) IV. Interpret the results (2 marks) 6. Relationship between multiple numerical variables: does salary depend on age and working experience? (30 marks) i. Create a scatter plot between Age and Salary and interpret the graphs (5 marks) ii. Create a scatter plot of Working experience and Salary and interpret the graph (5 marks) iii. Run regressions of Salary on Age, Salary on Working experience, and Salary on Age and Working experience together, respectively (10 marks) iv. Interpret the regression output (10 marks) Assignment structure and task: 1. Introduction-Introduce the business problems. (10 marks) i. Describe the main objective of the researchers who collected this dataset (3 marks) ii. Describe how you want to achieve this objective in this assignment (3 marks) iii. List all statistical hypotheses you want to test in this assignment and indicate how the hypotheses are related to the research objective above. (4 marks) Hint: you should write this section after you finish all the following tasks. 2. Do you think pay is gender-biased? (10 marks) i. Formulate a statistical hypothesis to test the gender-unbiasedness of payment (2 marks) ii. Run the statistical test of the hypothesis (5 marks) iii. Conclude your test result (3 marks) 3. Do you think the training improves the job satisfaction? (20 marks) i. Formulate a statistical test to support your opinion (3 marks) ii. What is your null hypothesis and what is your alternative hypothesis? (2 marks) iii. What is your chosen significance level of the test? (1 mark) iv. Show your test workings (4 marks) Critically Interpret the test result and show alternative ways of assessment. (10 marks) V. 4. Are there regional differences in payment? (10 marks) i. Formulate the test of equal Salary across all Regions (5 marks) ii. Run the ANOVA test (8 marks) iii. Interpret your results (3 marks) 5. Do you think Life Happiness Score is gender biased? (10 marks) 1. Create a two-way table of Gender and Life Happiness Score (2 marks) II. Formulate the statistical test of independence: the null hypothesis and the alternative hypothesis (2 marks) III. Run the test (4 marks) IV. Interpret the results (2 marks) 6. Relationship between multiple numerical variables: does salary depend on age and working experience? (30 marks) i. Create a scatter plot between Age and Salary and interpret the graphs (5 marks) ii. Create a scatter plot of Working experience and Salary and interpret the graph (5 marks) iii. Run regressions of Salary on Age, Salary on Working experience, and Salary on Age and Working experience together, respectively (10 marks) iv. Interpret the regression output (10 marks)
Step by Step Solution
There are 3 Steps involved in it
1 Expert Approved Answer
Step: 1 Unlock

Question Has Been Solved by an Expert!
Get step-by-step solutions from verified subject matter experts
Step: 2 Unlock
Step: 3 Unlock