

Question: Assignment Submission & Scoring Assignment Submission For this assignment, you submit answers by questions. Assignment Scoring Your best submission for each question part is used
![is used for your score. 5. [412.5 Points] DETAILS ASWSBE14 8.TB.2.035. 0/2](https://s3.amazonaws.com/si.experts.images/answers/2024/07/6686e4ad15308_3966686e4acee8b4.jpg)
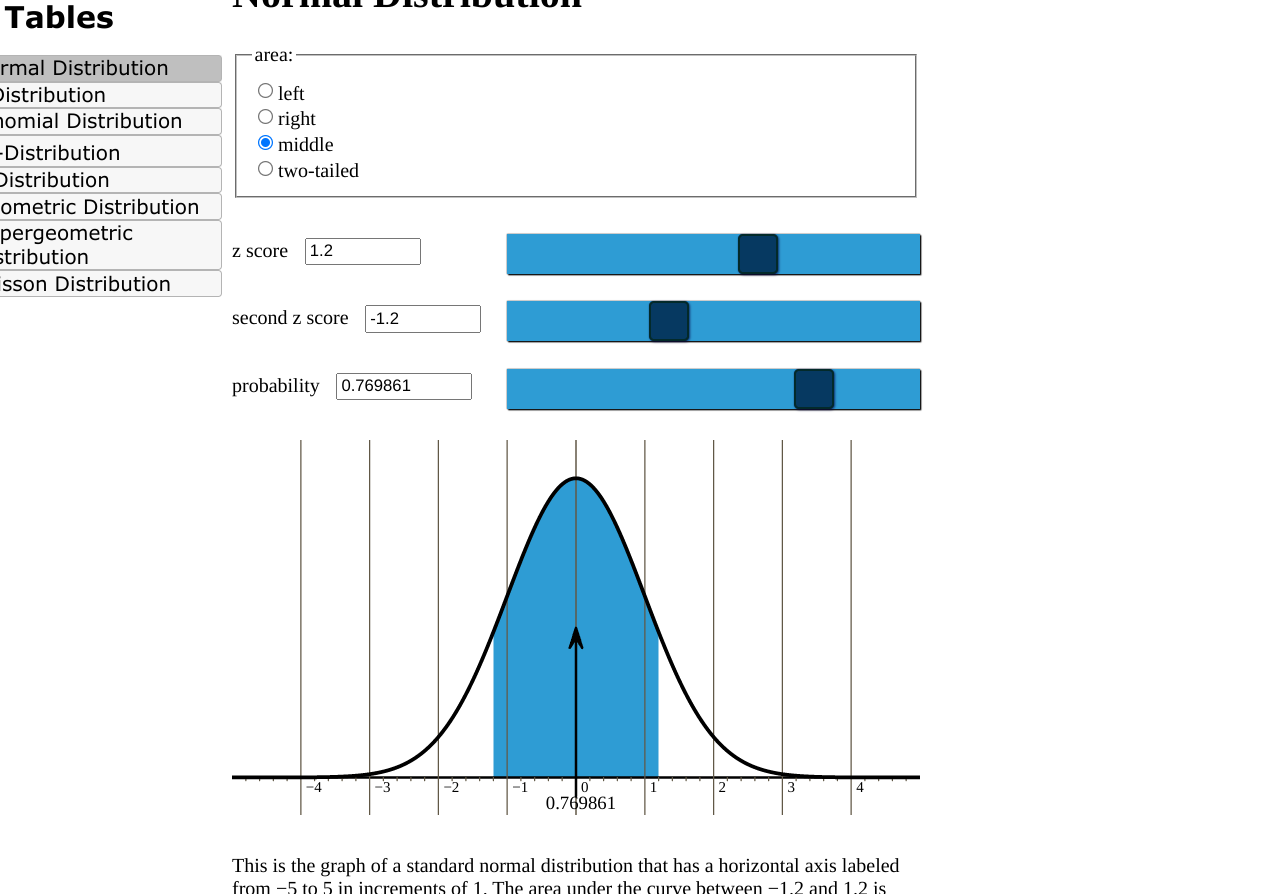
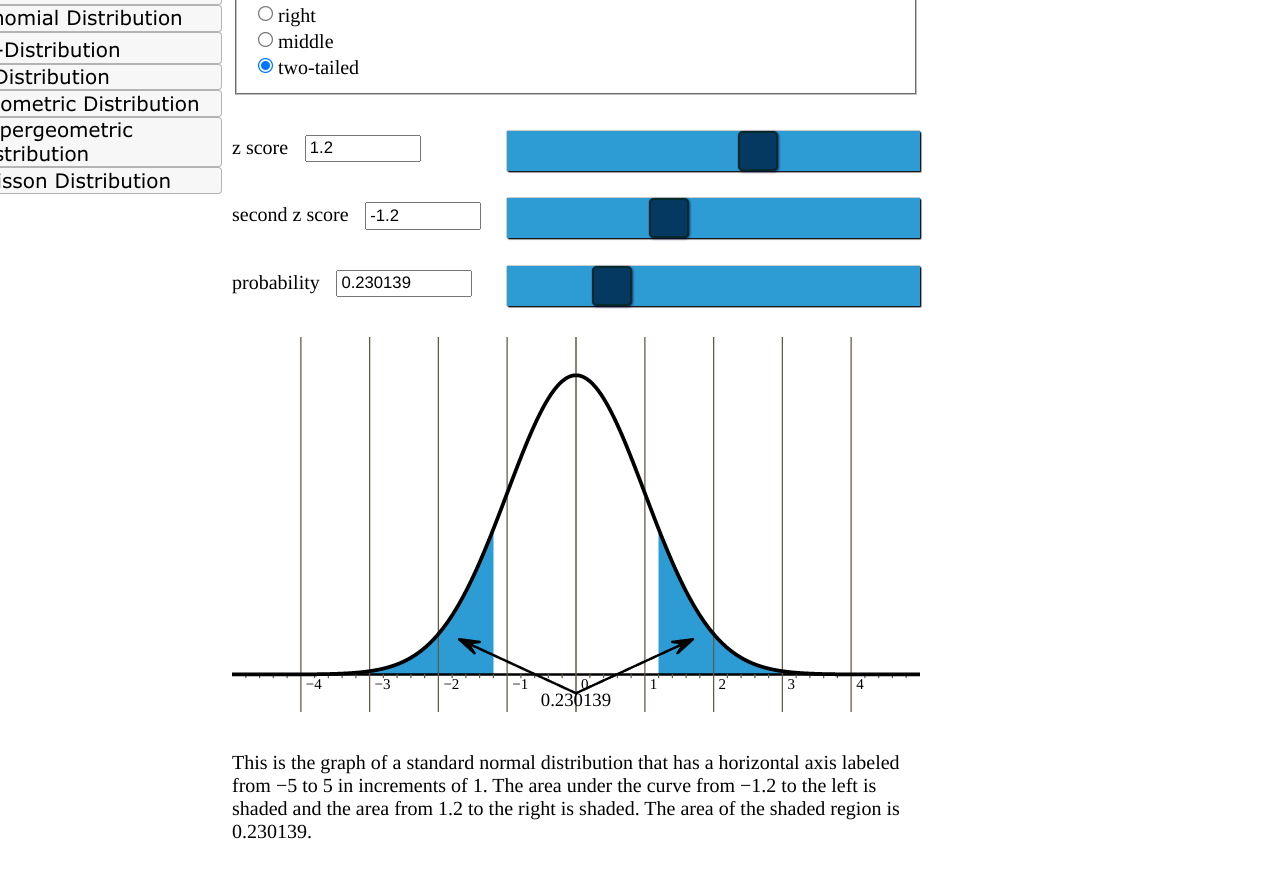
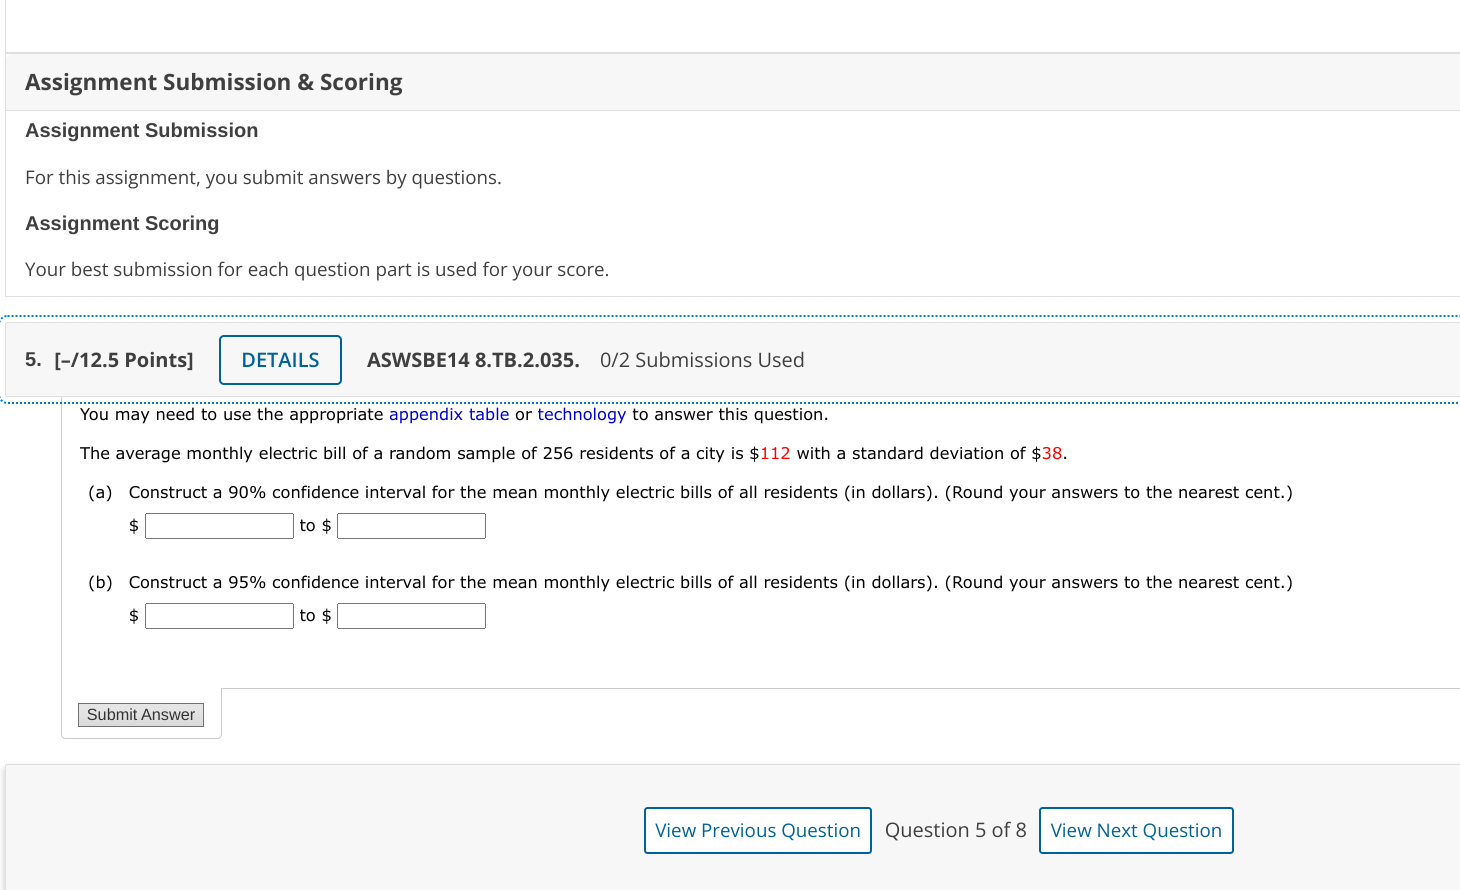
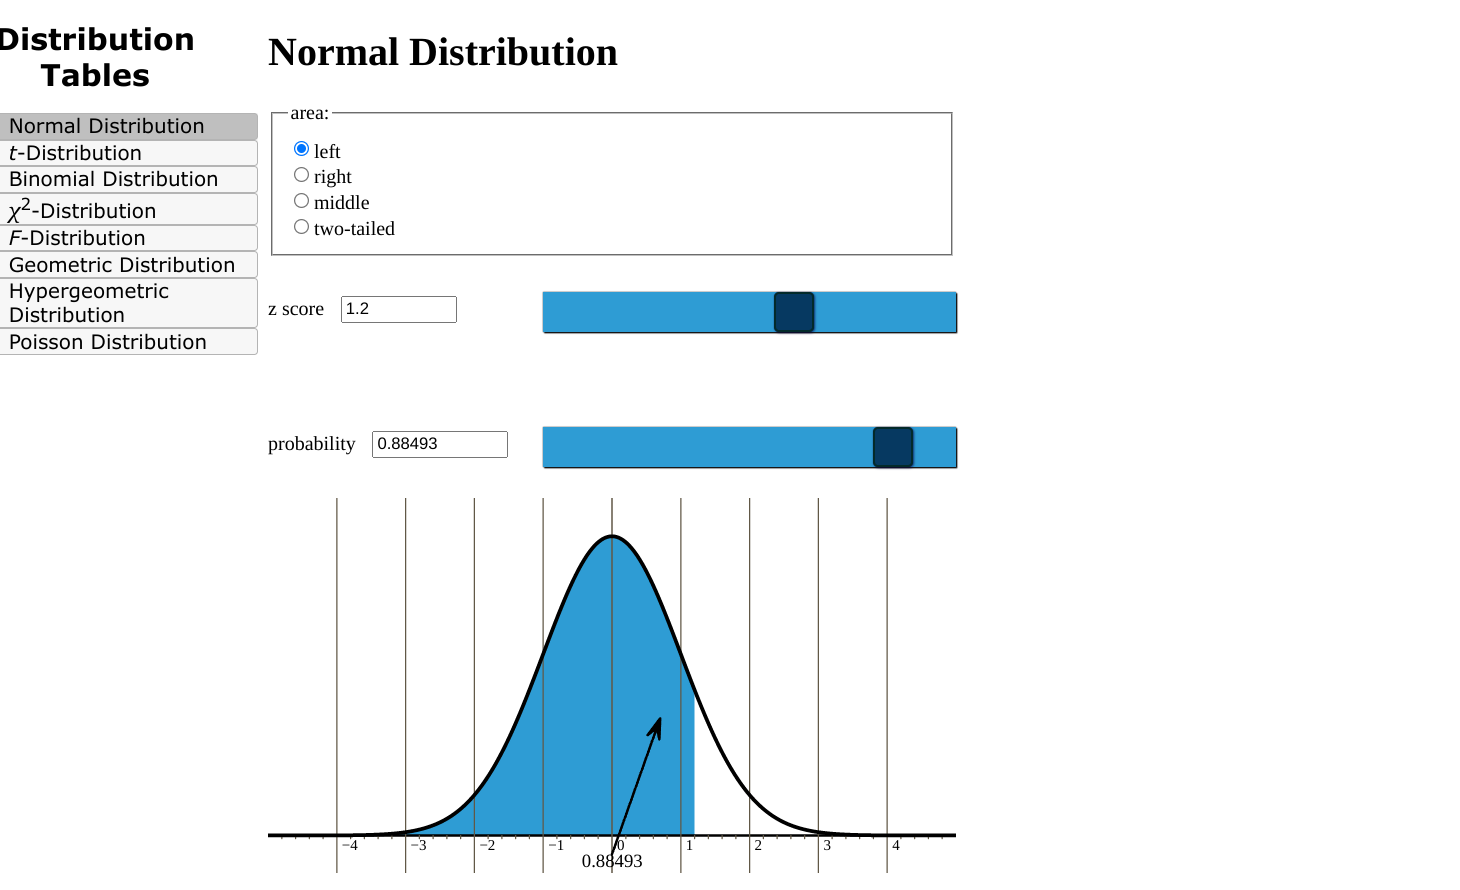
Assignment Submission & Scoring Assignment Submission For this assignment, you submit answers by questions. Assignment Scoring Your best submission for each question part is used for your score. 5. [412.5 Points] DETAILS ASWSBE14 8.TB.2.035. 0/2 Submissions Used The average monthly electric bill of a random sample of 256 residents of a city is $112 with a standard deviation of $38. (a) Construct a 90% confidence interval for the mean monthly electric bills of all residents (in dollars). (Round your answers to the nearest cent.) $l |t$| l (b) Construct a 95% confidence interval for the mean monthly electric bills of all residents (in dollars). (Round your answers to the nearest cent.) $l Itwl i Submit Answer View Previous Question Question 5 of 8 Distribution Normal Distribution Tables area: Normal Distribution t-Distribution O left Binomial Distribution O right X-Distribution O middle F-Distribution O two-tailed Geometric Distribution Hypergeometric Distribution z score 1.2 Poisson Distribution probability 0.88493 -3 -2 4 0.88493 12 3Distribution Normal Distribution Tables area: Normal Distribution t-Distribution O left Binomial Distribution O right X-Distribution O middle F-Distribution O two-tailed Geometric Distribution Hypergeometric Distribution z score 1.2 Poisson Distribution probability 0.11507 4 0.11507 2 3Tables area: rmal Distribution istribution O left omial Distribution O right Distribution O middle Distribution O two-tailed ometric Distribution pergeometric tribution z score 1.2 sson Distribution second z score -1.2 probability 0.769861 4 0.769861 This is the graph of a standard normal distribution that has a horizontal axis labeled fromiomial Distribution Distribution Distribution ometric Distribution pergeometric ;tribution 'sson Distribution 0 right 0 middle two-tailed This is the graph of a standard normal distribution that has a horizontal axis labeled from 5 to 5 in increments of l. The area under the curve from -1.2 to the left is shaded and the area from 1.2 to the right is shaded. The area of the shaded region is 0.230139
Step by Step Solution
There are 3 Steps involved in it

Get step-by-step solutions from verified subject matter experts