

Question: Assignment: What are some potential biases found in the sampling method? Comment on the skewness and symmetry of the graphic. Data: 680000, 693000, 712000, 880000,
Assignment: What are some potential biases found in the sampling method? Comment on the skewness and symmetry of the graphic.
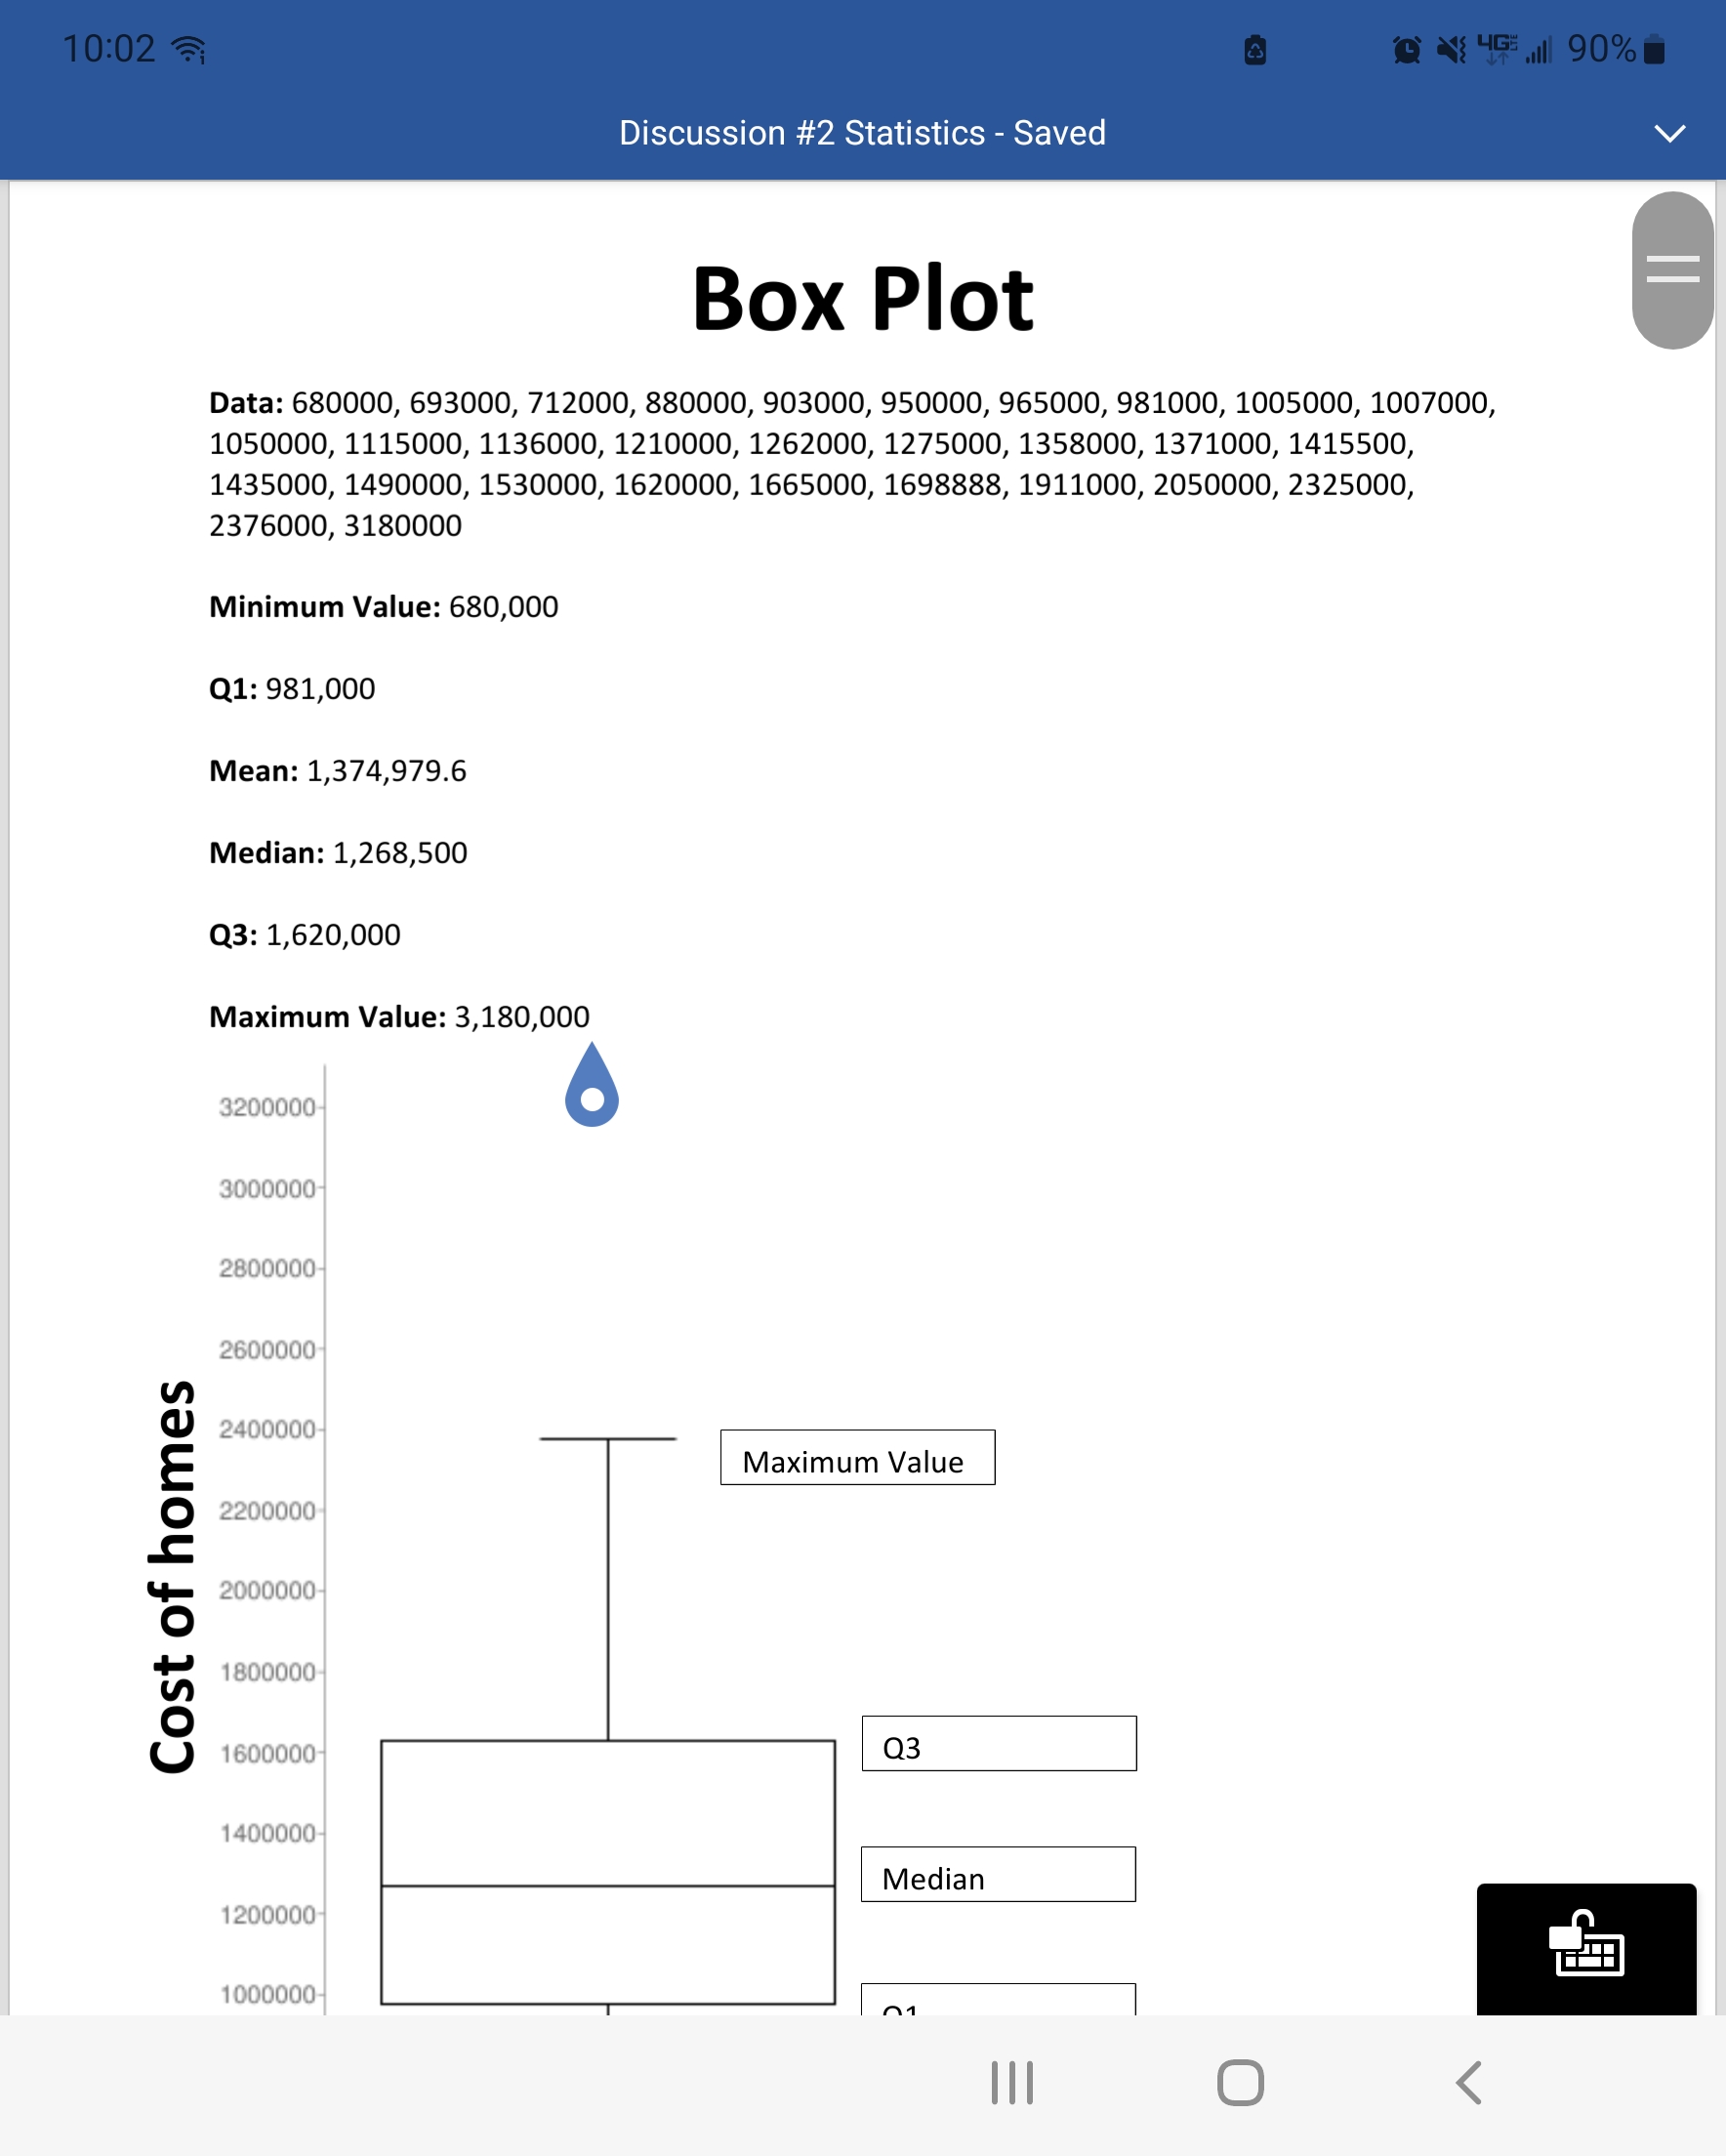
Data: 680000, 693000, 712000, 880000, 903000, 950000, 965000, 981000, 1005000, 1007000, 1050000, 1115000, 1136000, 1210000, 1262000, 1275000, 1358000, 1371000, 1415500, 1435000, 1490000, 1530000, 1620000, 1665000, 1698888, 1911000, 2050000, 2325000, 2376000, 3180000
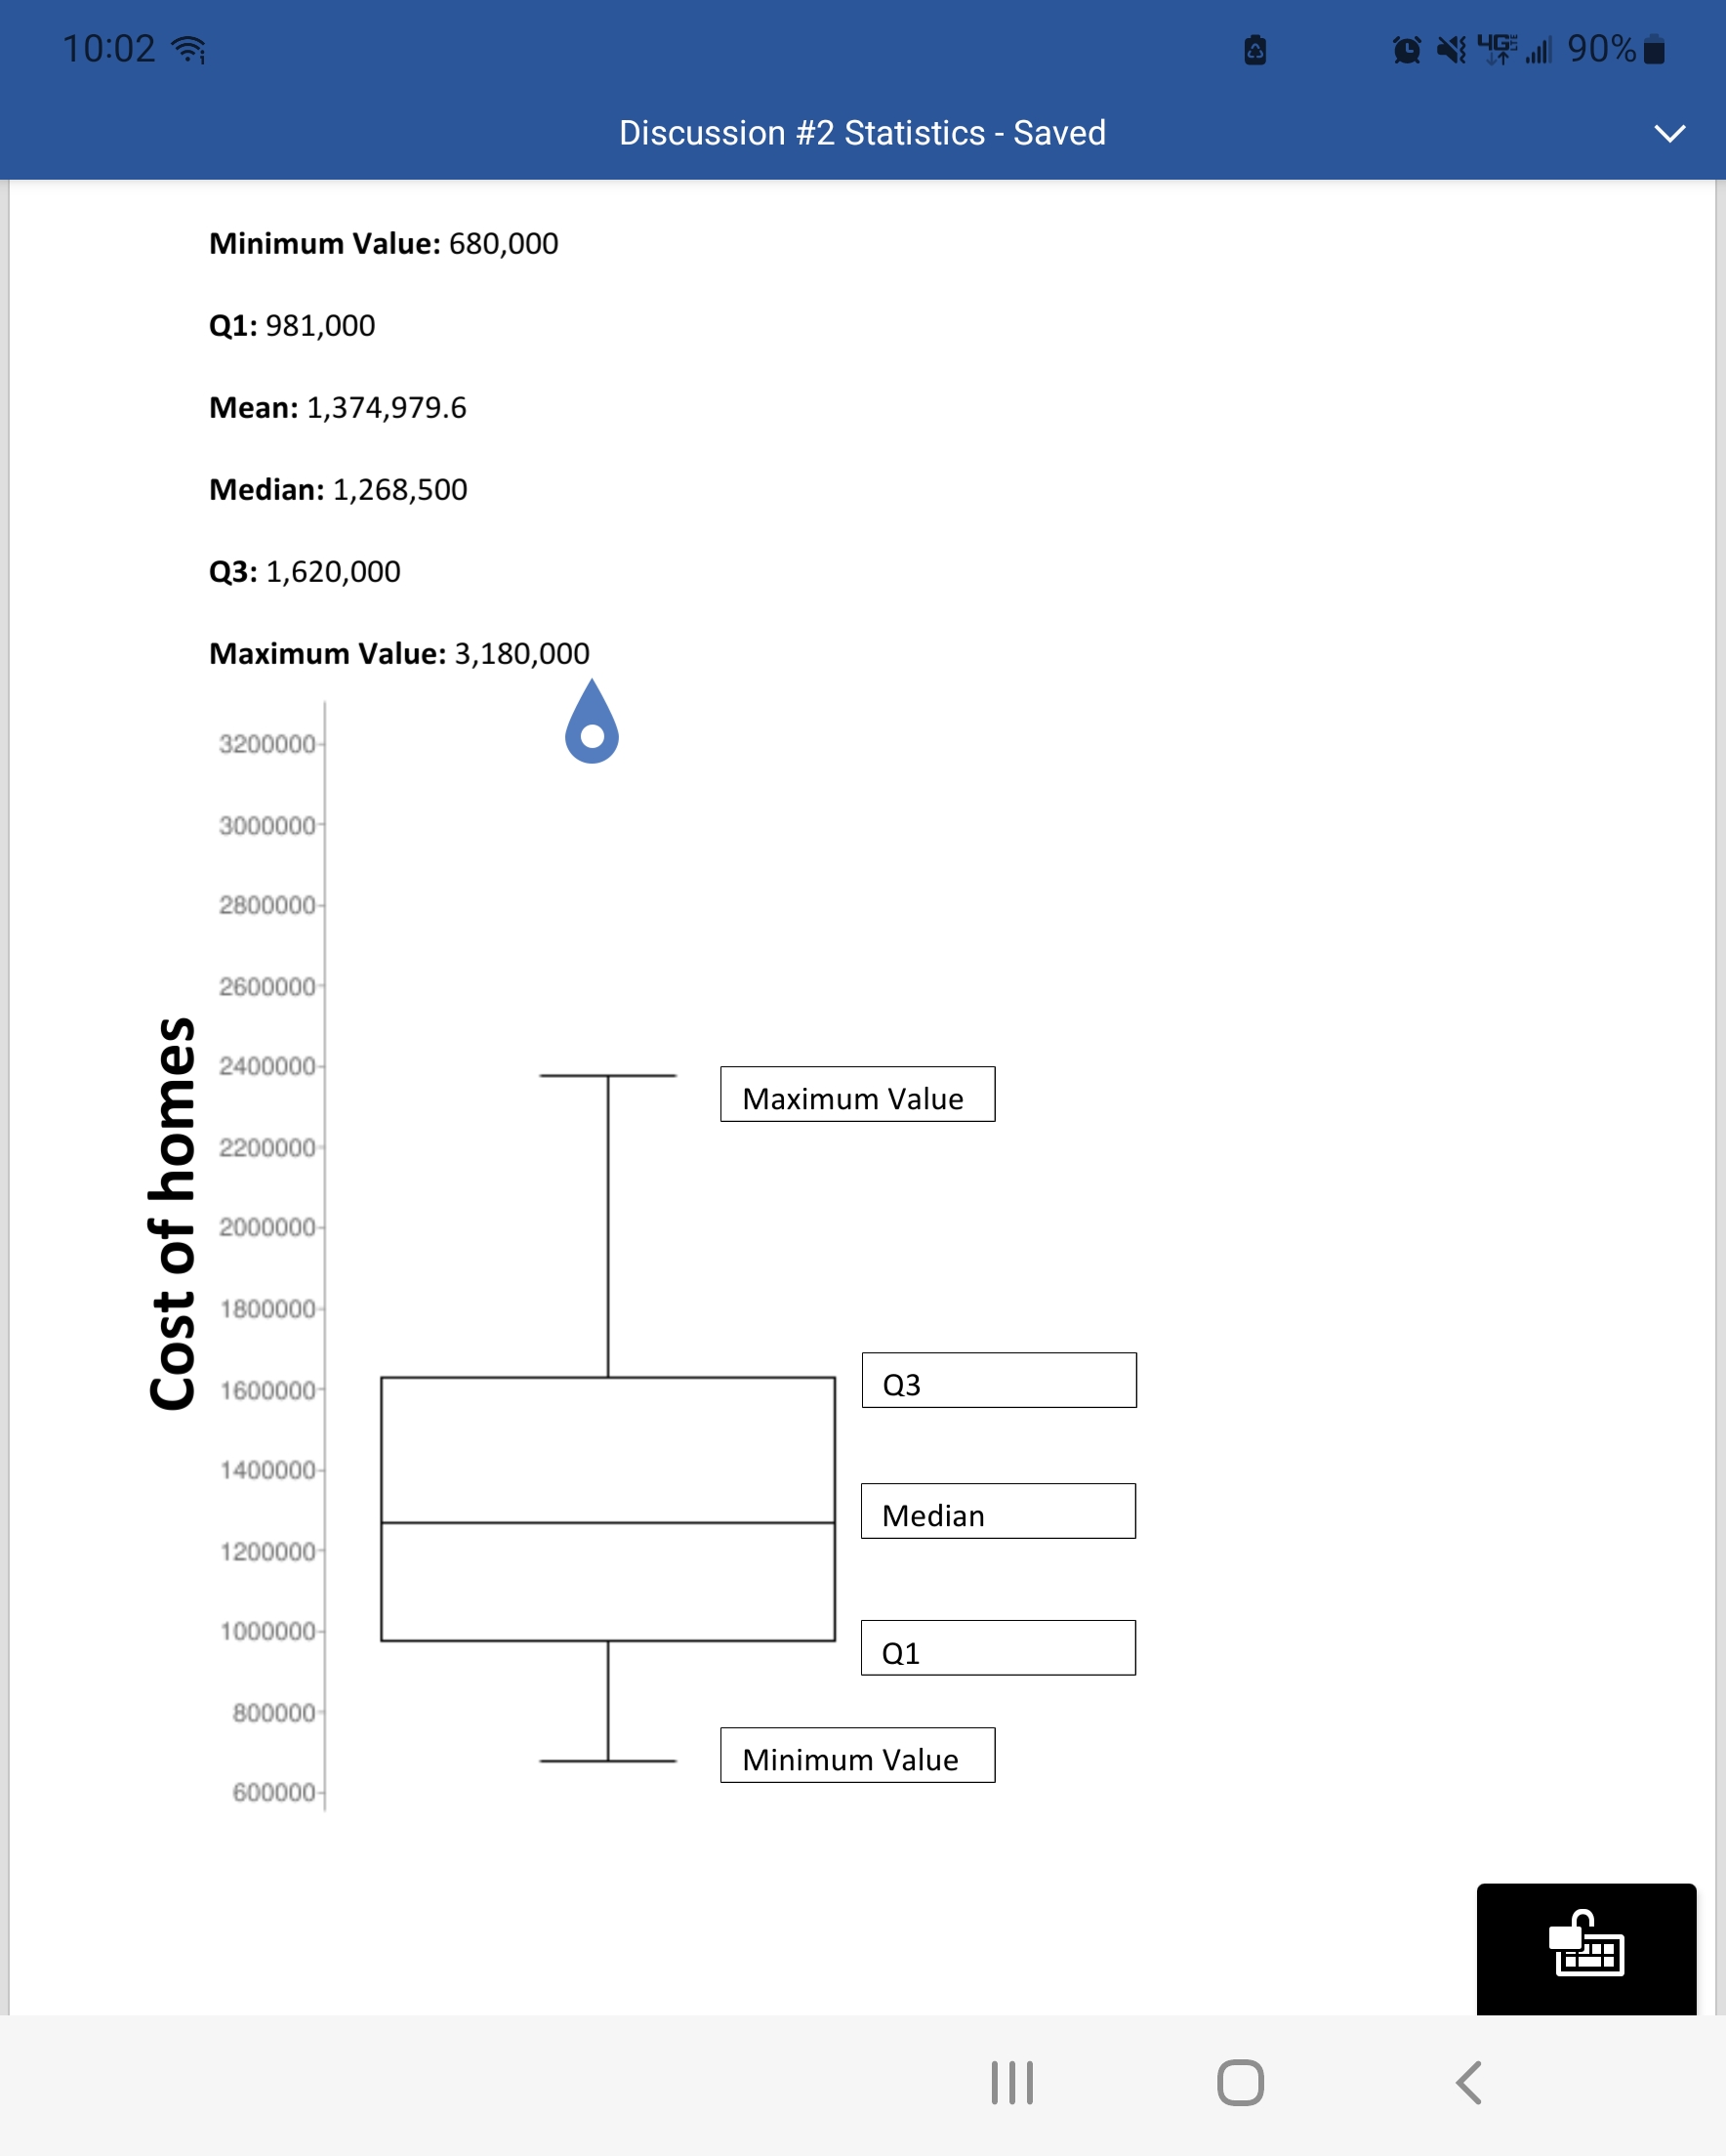
Minimum Value: 680,000
Q1: 981,000
Mean: 1,374,979.6
Median: 1,268,500
Q3: 1,620,000
Maximum Value: 3,180,000
10:02 ~; Q 4 1 90% Discussion #2 Statistics - Saved Minimum Value: 680,000 Q1: 981,000 Mean: 1,374,979.6 Median: 1,268,500 Q3: 1,620,000 Maximum Value: 3,180,000 3200000- 3000000- 2800000- 2600000- 2400000- Maximum Value 2200000- Cost of homes 2000000- 1800000- 1600000- Q3 1400000- Median 1200000 1000000- Q1 800000- Minimum Value 600000- 2 O
Step by Step Solution
There are 3 Steps involved in it

Get step-by-step solutions from verified subject matter experts