

Question: Assignment You will need to complete the requested reports for your manager. Download the spreadsheet with the raw data and create the requested reports using
Assignment
You will need to complete the requested reports for your manager. Download the spreadsheet with the raw data and create the requested reports using PivotTables and PivotCharts.
Your final Excel workbook should have more than of six (6) worksheets. The five requested above (plus the raw data), and any others to help make your recommendations:
- Data
- Sales Distribution (Country)
- Top Five Categories
- Top Three Products-Category
- Top Three Products-Category Sales Change
- Top Five Customers
Aside from the raw data tab, all report tabs should have both a PivotTable and a PivotChart.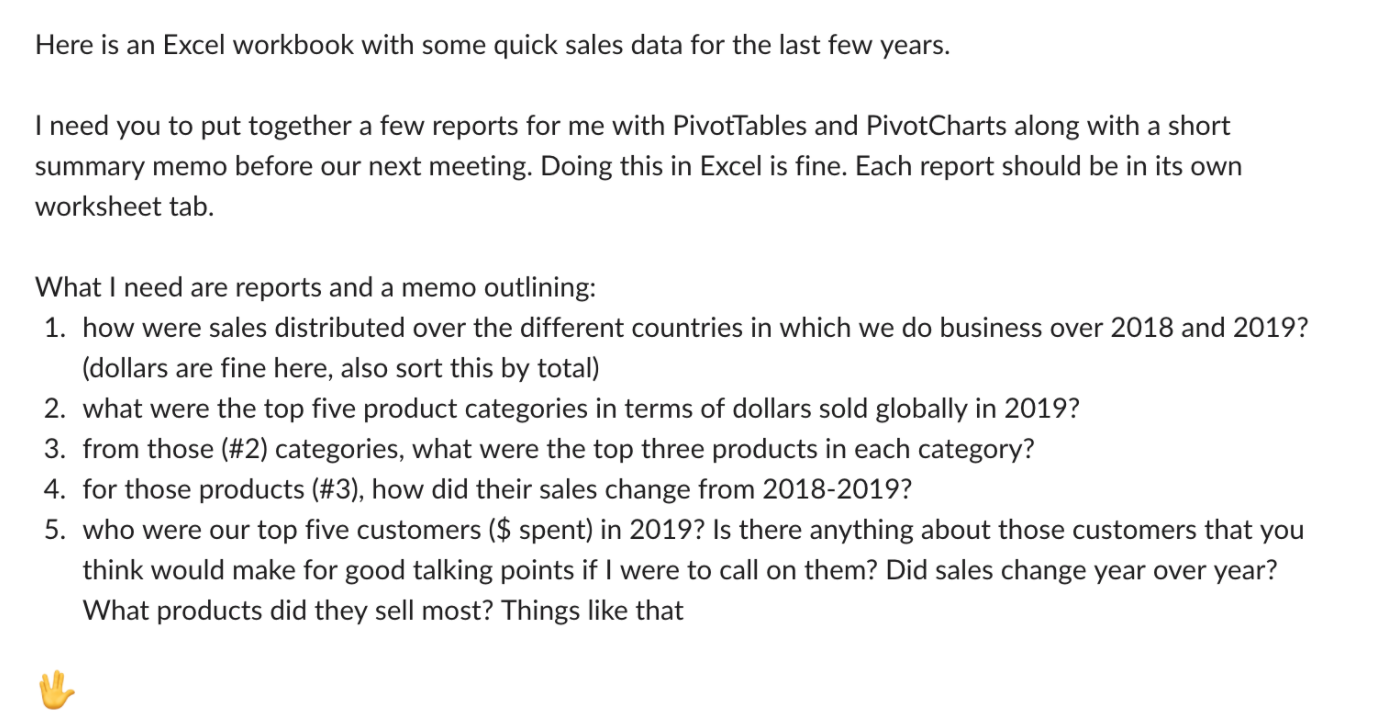
Here is an Excel workbook with some quick sales data for the last few years. I need you to put together a few reports for me with PivotTables and PivotCharts along with a short summary memo before our next meeting. Doing this in Excel is fine. Each report should be in its own worksheet tab. What I need are reports and a memo outlining: 1. how were sales distributed over the different countries in which we do business over 2018 and 2019? (dollars are fine here, also sort this by total) 2. what were the top five product categories in terms of dollars sold globally in 2019? 3. from those (#2) categories, what were the top three products in each category? 4. for those products (#3), how did their sales change from 2018-2019? 5. who were our top five customers ($ spent) in 2019? Is there anything about those customers that you think would make for good talking points if I were to call on them? Did sales change year over year? What products did they sell most? Things like that Here is an Excel workbook with some quick sales data for the last few years. I need you to put together a few reports for me with PivotTables and PivotCharts along with a short summary memo before our next meeting. Doing this in Excel is fine. Each report should be in its own worksheet tab. What I need are reports and a memo outlining: 1. how were sales distributed over the different countries in which we do business over 2018 and 2019? (dollars are fine here, also sort this by total) 2. what were the top five product categories in terms of dollars sold globally in 2019? 3. from those (#2) categories, what were the top three products in each category? 4. for those products (#3), how did their sales change from 2018-2019? 5. who were our top five customers ($ spent) in 2019? Is there anything about those customers that you think would make for good talking points if I were to call on them? Did sales change year over year? What products did they sell most? Things like that
Step by Step Solution
There are 3 Steps involved in it

Get step-by-step solutions from verified subject matter experts