

Question: Assignment: Your are to build an excel math model sheet of the supermarket annual business results based on the attached sales history. The sales history
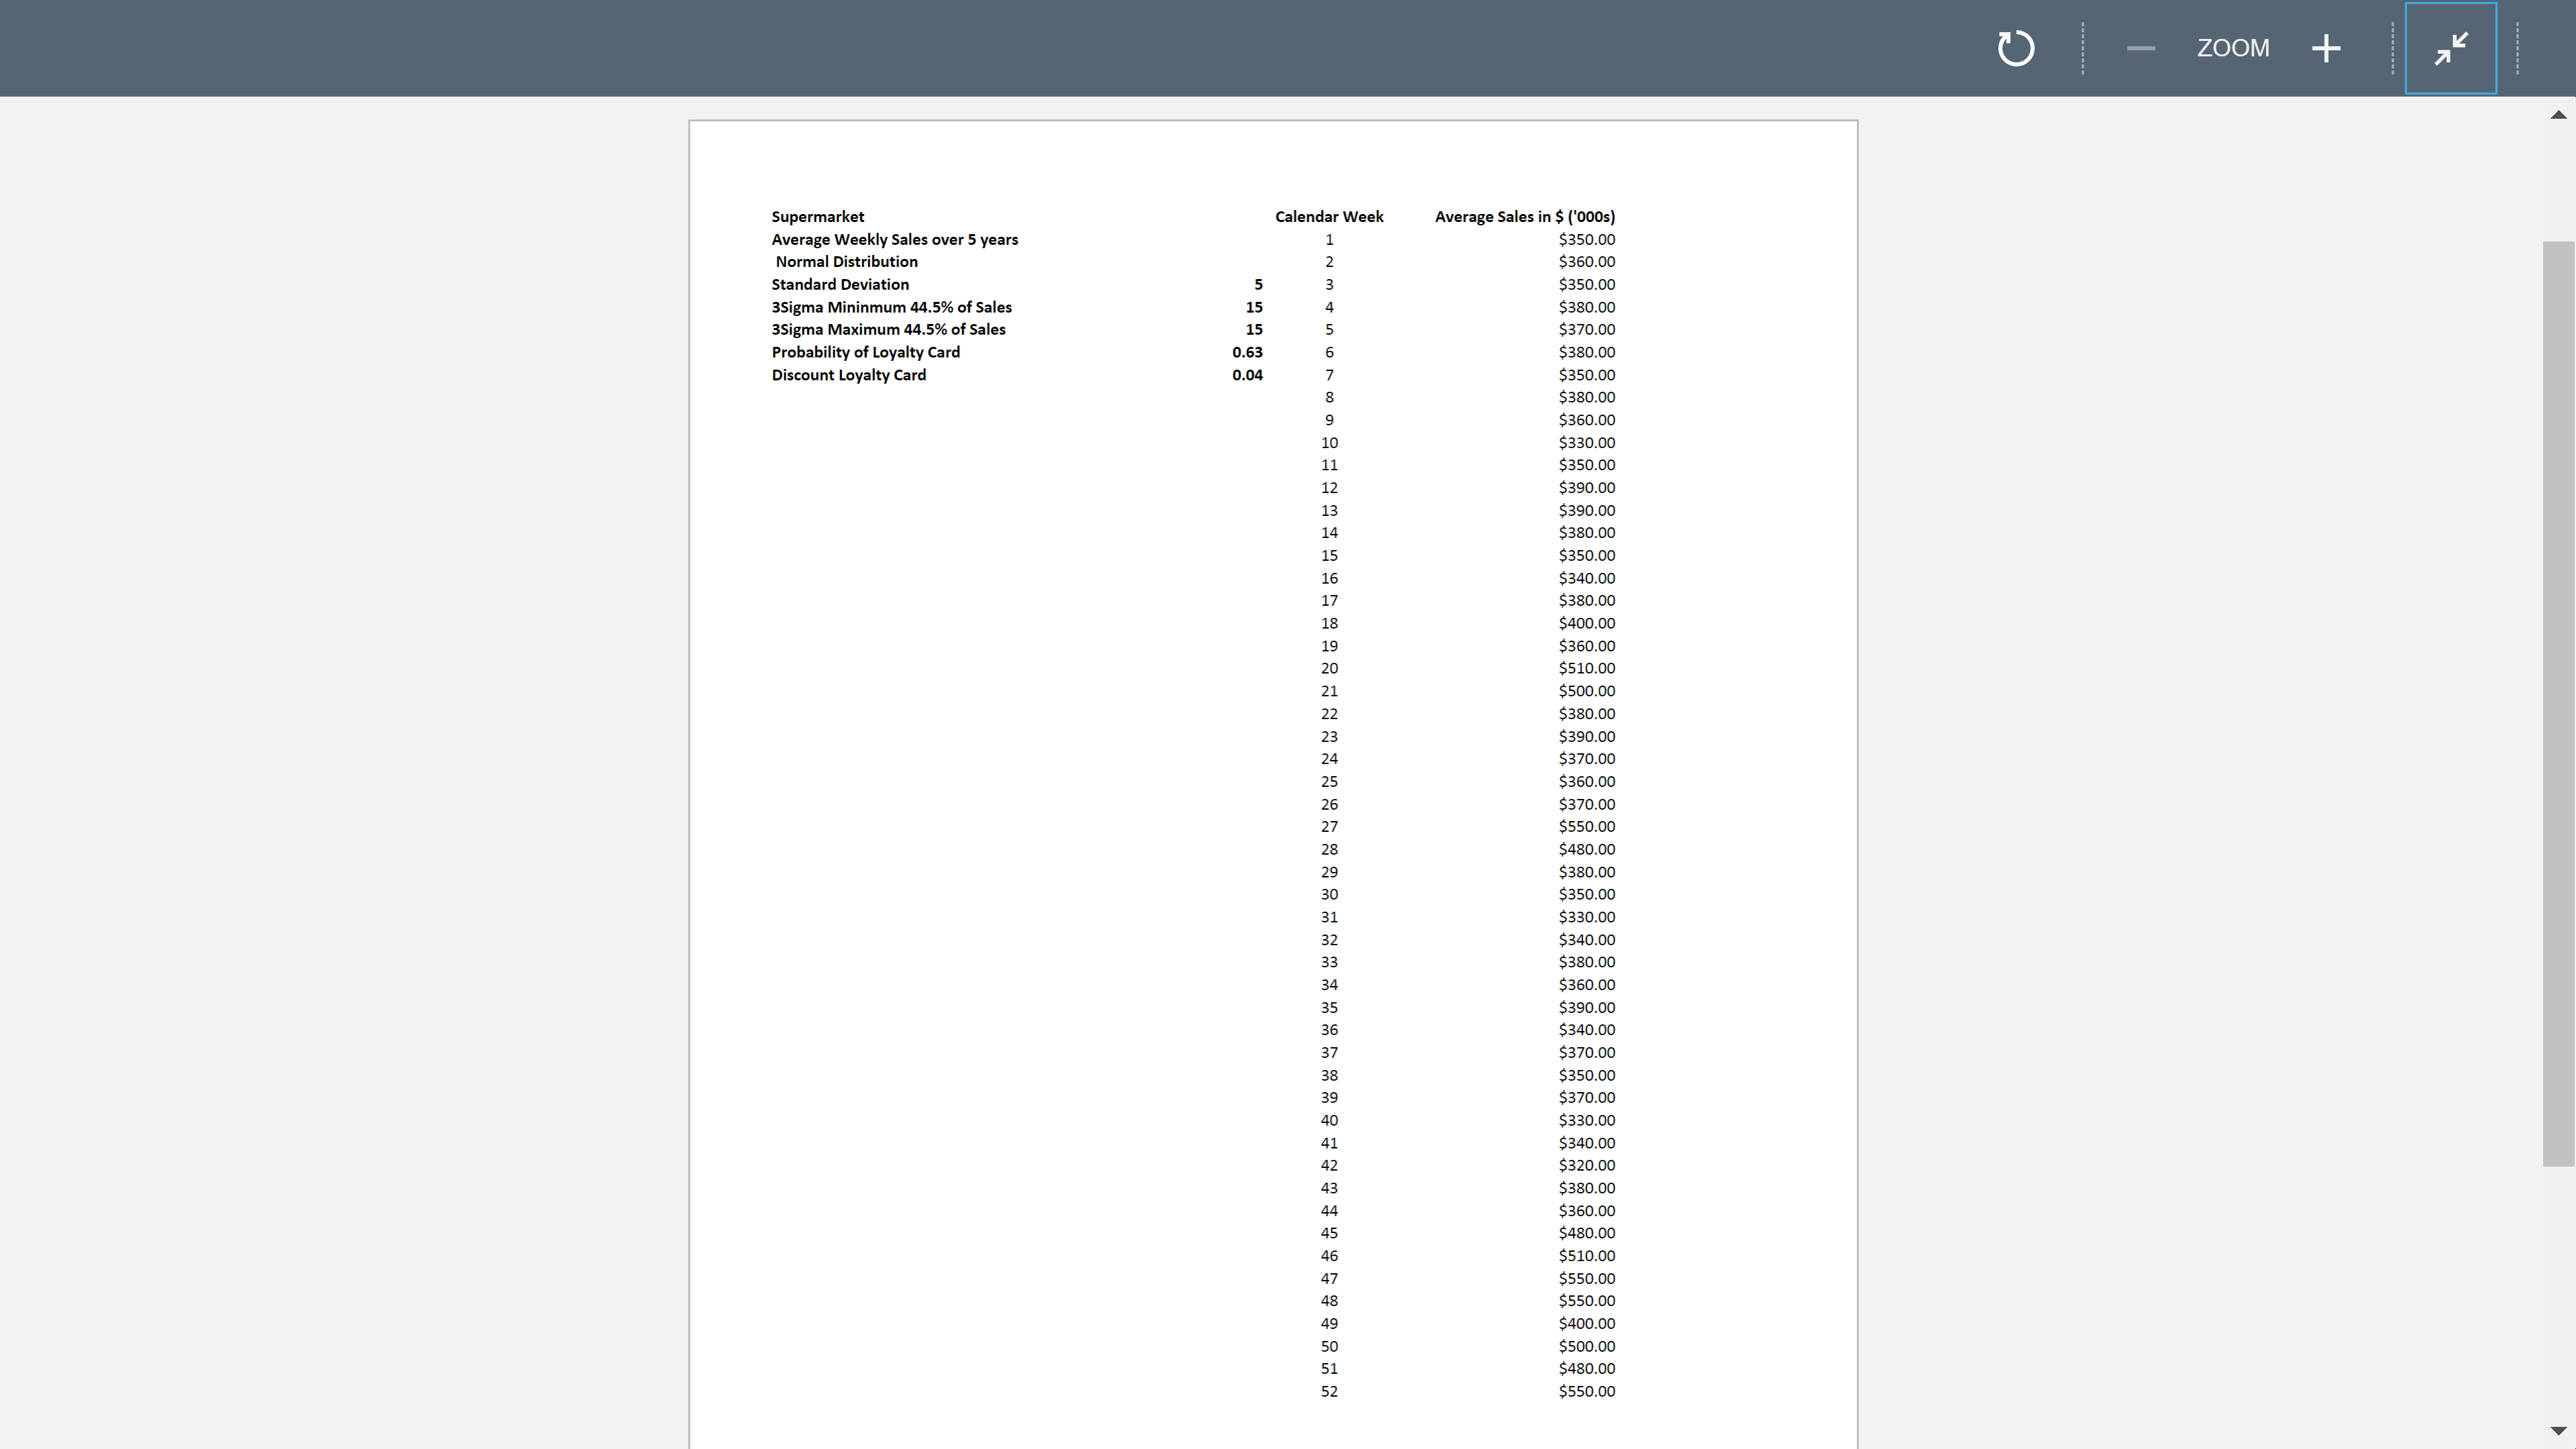
Assignment: Your are to build an excel math model sheet of the supermarket annual business results based on the attached sales history. The sales history file is based on a regression analysis performed by the sales business analyst department. It has Average (Mean) monthly sales from past five years.
Loyalty Card - you expect that 63% of your customers will sign up. The loyalty card will give them 4% off their sales order.
Helpful Guidelines:
For the Deterministic Model, use the Average Weekly Sales. To get discount per week, multiply each average weekly sale by the average discount of 0.63 * 0.04. Calculate new sales, and then the difference in profit margin (The cost of the Loyalty Program). Tabulate it.
For the Stochastic Model, use a Normal Distribution Curve, with the Mean being the Average Weekly Sales, and the weekly Standard Deviation being $5,000. That is, all weekly sales will fall between the Average - 3 Standard Deviation and Average + 3 Standard Deviation. For example, if average weekly says is 100,000 then the 99% of weekly sales would fall between 85,000 and 115,000. Use the RANDBETWEEN function in excel to get this random sales number. To get discount per week, once again use a RAND () function to get a 0 (no loyalty card) or a 1 (loyalty card) and calculate the random discount based on loyalty card info. Calculate new sales, and difference in profit margin (The cost of the Loyalty Program). Now, since this is a stochastic model, you need to run it three times (use the F9 function to re-calculate spreadsheet). Make sure you tabulate each iteration so you can get a MEAN of the Cost of Loyalty Program.
Calculate the new profit margin based on the results from your deterministic model and your stochastic model.
Input Data:
At checkout, 63% of customers have a loyalty card that gives them 4% off their raw order amount.
Normal Distribution - Mean Weekly Sales, with a Standard Deviation of $5000
Step by Step Solution
There are 3 Steps involved in it

Get step-by-step solutions from verified subject matter experts