

Question: Assume that a randomly selected subject is given a bone density test. Those test scores are normally distributed with a mean of 0 and a
Assume that a randomly selected subject is given a bone density test. Those test scores are normally distributed with a mean of 0 and a standard deviation of 1. Draw a graph and find the bone density test scores that can be used as cutoff values separating the lowest 7?% and highest 7?%, indicating levels that are too low or too?high, respectively.
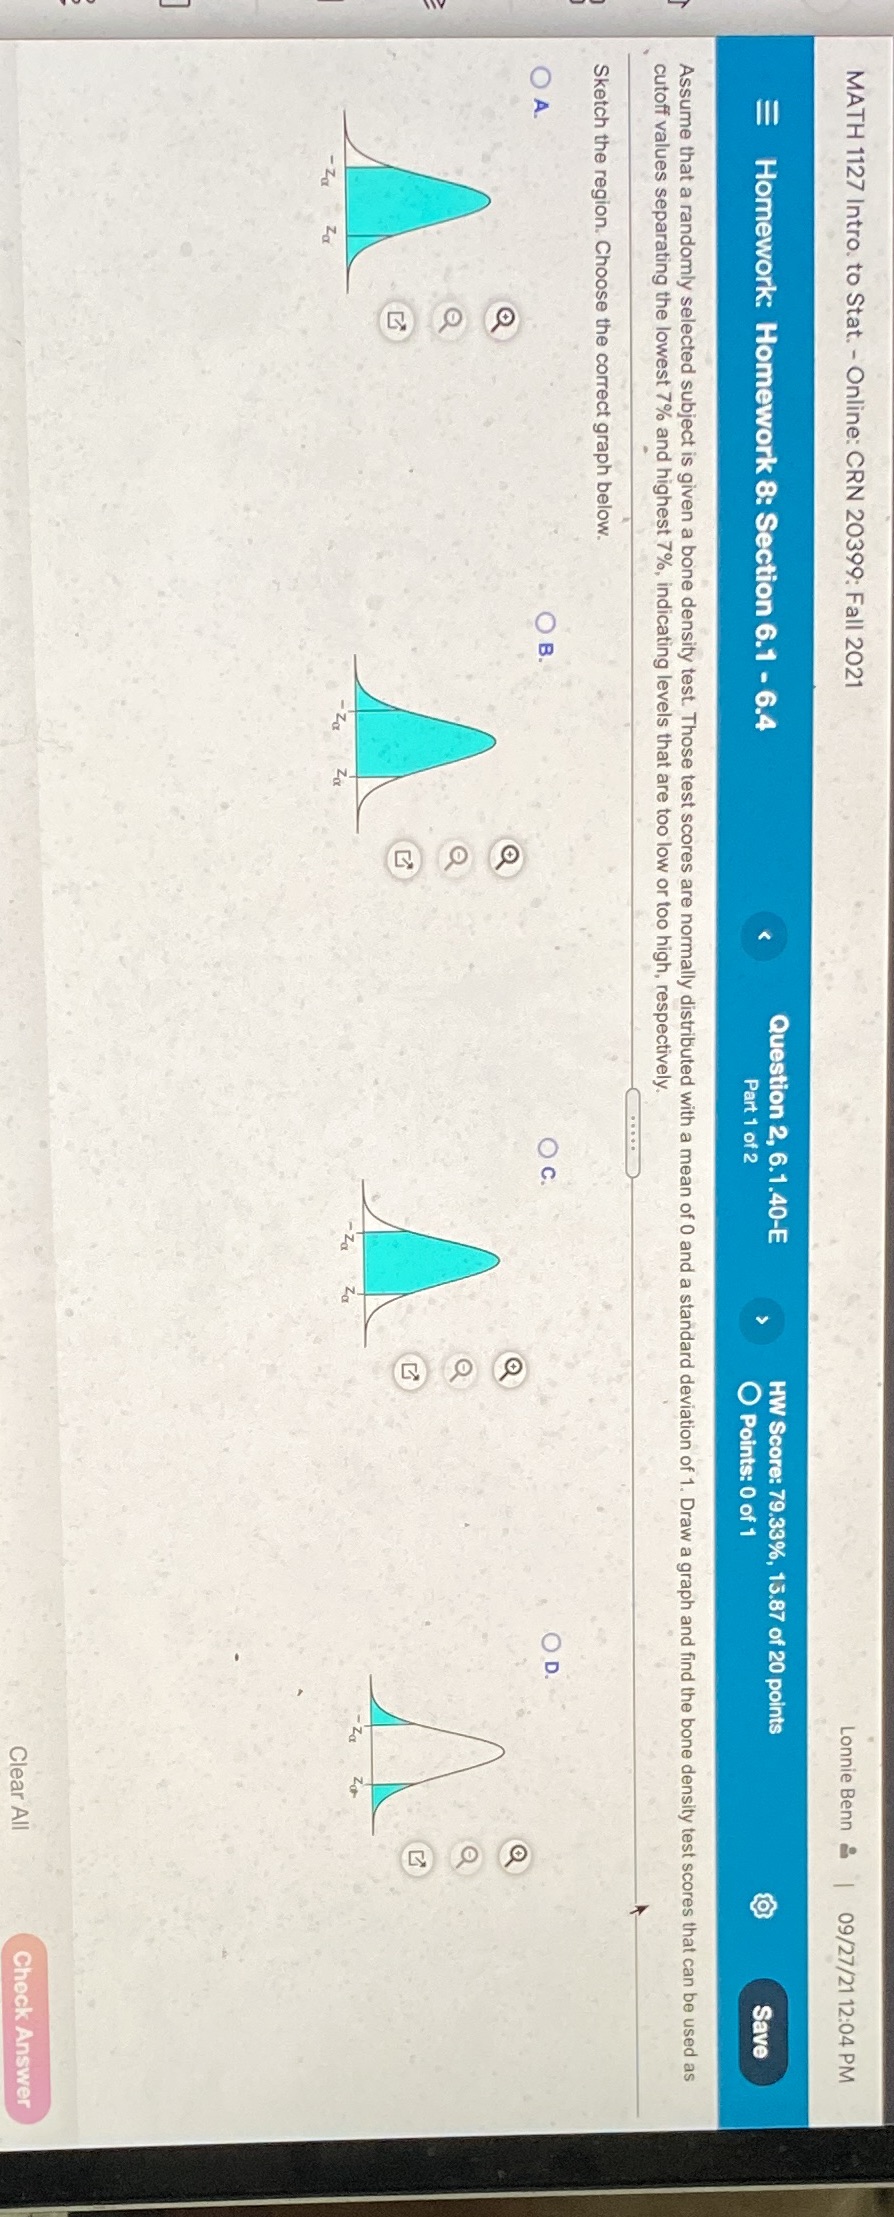
MATH 1127 Intro. to Stat. - Online: CRN 20399: Fall 2021 Lonnie Benn & |09/27/21 12:04 PM Homework: Homework 8: Section 6.1 - 6.4 Question 2, 6.1.40-E HW Score: 79.33%, 13.87 of 20 points Part 1 of 2 O Points: 0 of 1 Save Assume that a randomly selected subject is given a bone density test. Those test scores are normally distributed with a mean of 0 and a standard deviation of 1. Draw a graph and find the bone density test scores that can be used as cutoff values separating the lowest 7% and highest 7%, indicating levels that are too low or too high, respectively. Sketch the region. Choose the correct graph below. O A. O B. O c. OD. Of Za La Zo - Za - Za Za Za Clear All Check
Step by Step Solution
There are 3 Steps involved in it

Get step-by-step solutions from verified subject matter experts