

Question: Assume that a randomly selected subject is given a bone density test. Those test scores are normally distributed with a mean of 0 and a
Assume that a randomly selected subject is given a bone density test. Those test scores are normally distributed with a mean of 0 and a standard deviation of 1. Draw a graph and find the bone density test scores that can be used as cutoff values seperating the lowest 17 percent and highest 17 percent, indicating levels that are too low and too high....the bone density scores are ? (Round to two decimals as needed)
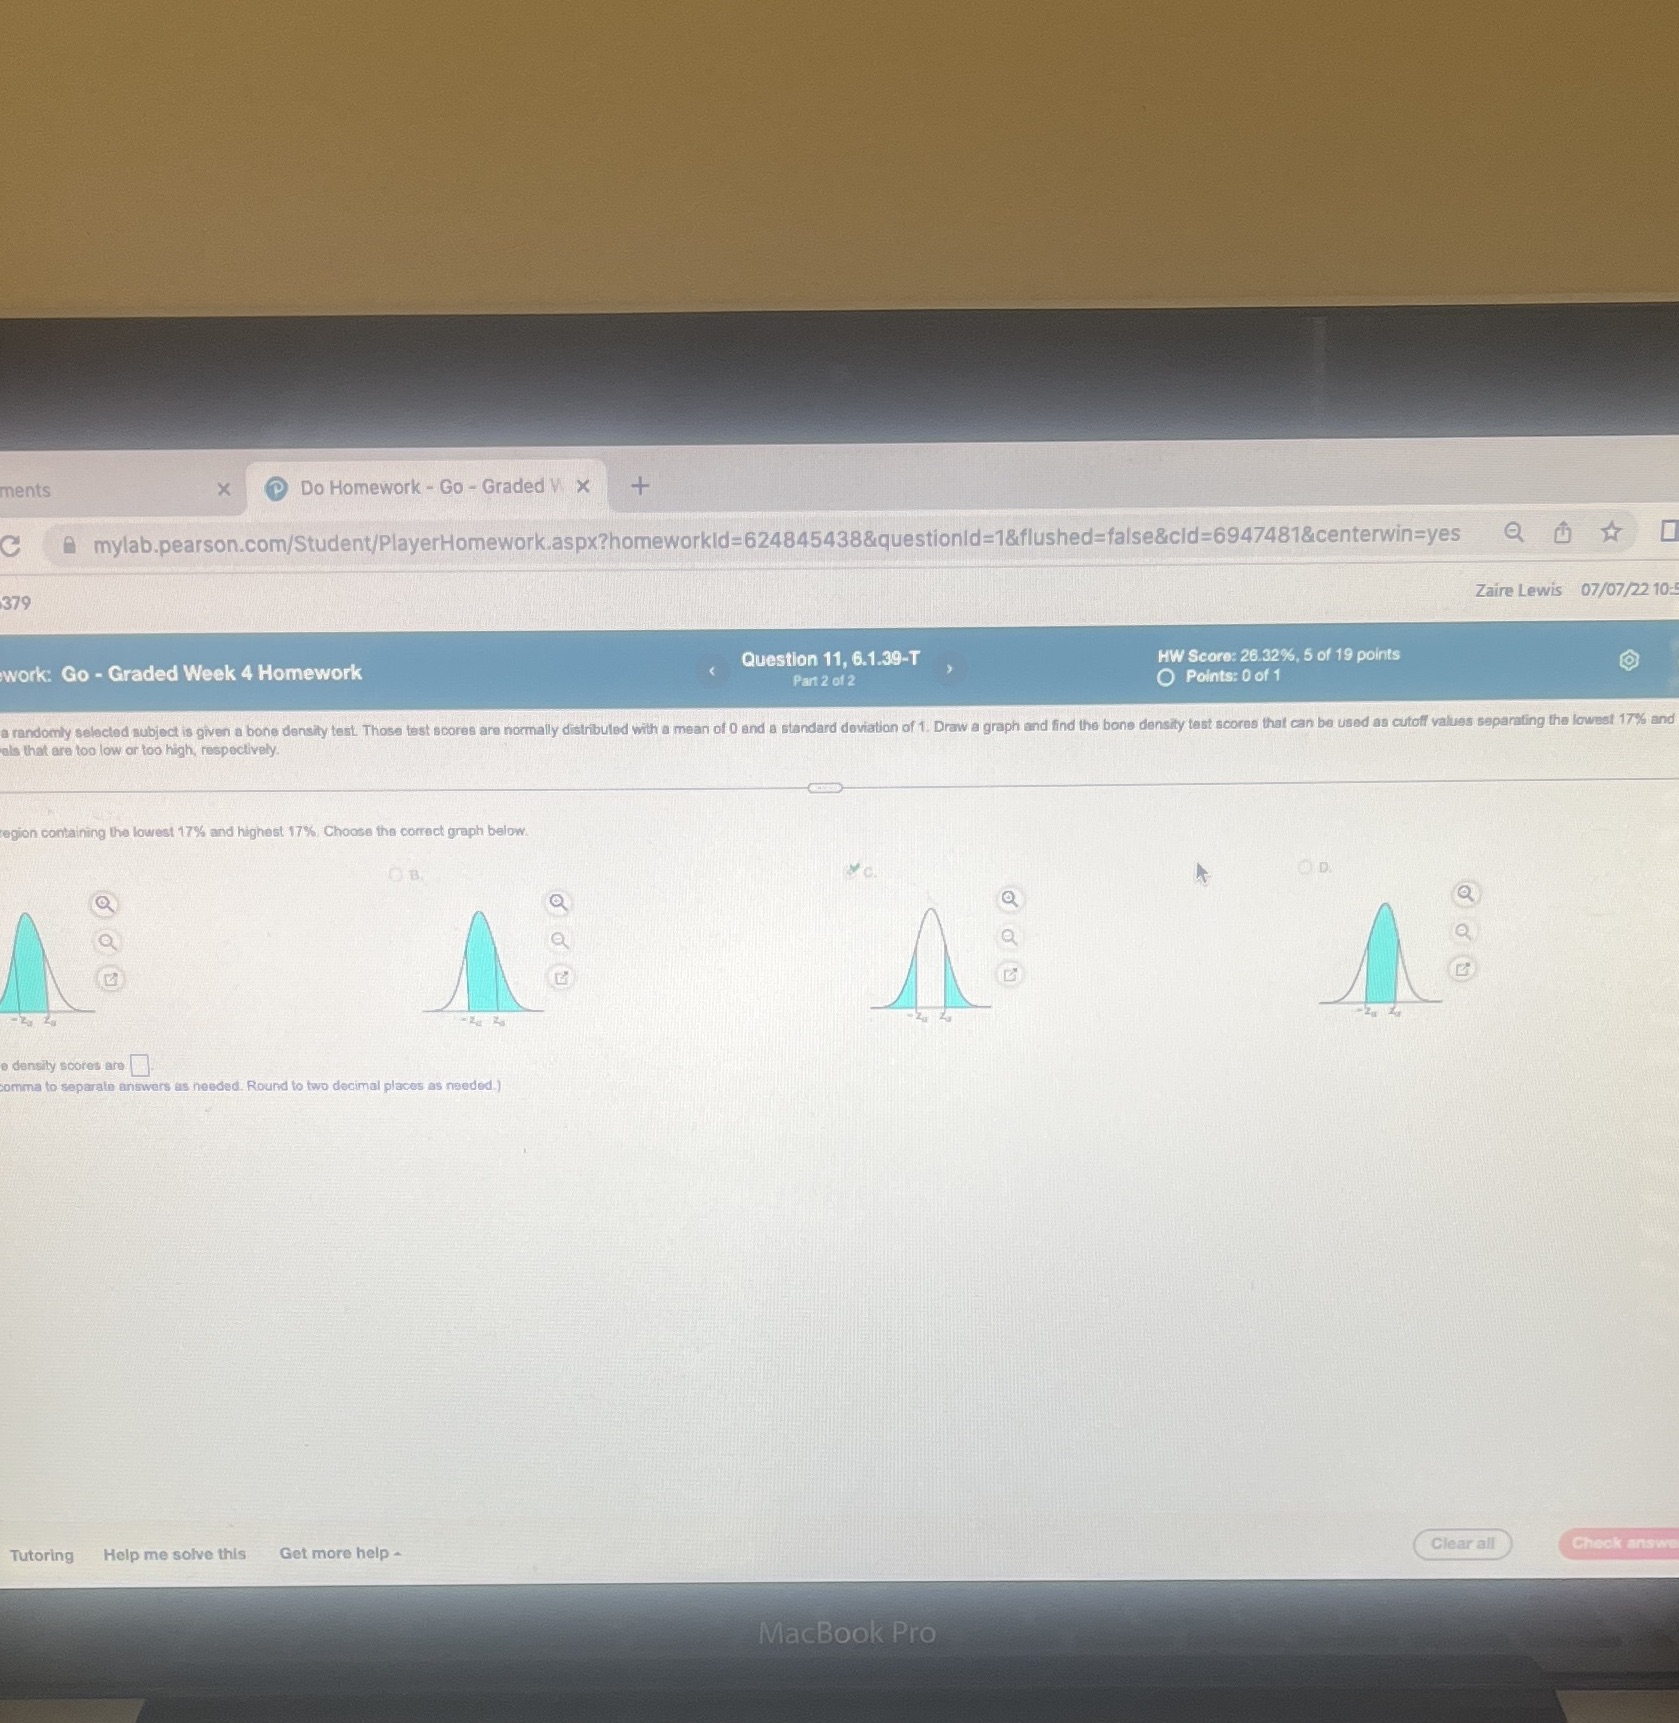
ments X Do Homework - Go - Graded V X + mylab.pearson.com/Student/PlayerHomework.aspx?homeworkid=624845438&questionid=1&flushed=false&cld=6947481¢erwin=yes Q 1 x 379 Zaire Lewis 07/07/22 10: work: Go - Graded Week 4 Homework Question 11, 6.1.39-T HW Score: 26.32%, 5 of 19 points Part 2 of 2 Points: 0 of 1 randomly selected subject is given a bone density test. Those test scores are normally distributed with a mean of 0 and a standard deviation of 1. Draw a graph and find the bone density test scores that can be used as cutoff values separating the lowest 17% an is that are too low or too high, respectively. egion containing the lowest 17% and highest 17% Choose the correct graph below D density scores are omma to separate answers decimal places as needed.) Tutoring Help me solve this Get more help - Clear all Check answ MacBook Pro
Step by Step Solution
There are 3 Steps involved in it

Get step-by-step solutions from verified subject matter experts