

Question: Assume that a scientist performs a microarray experiment to measure the gene expression values in yeast at seven different time points. Based on the
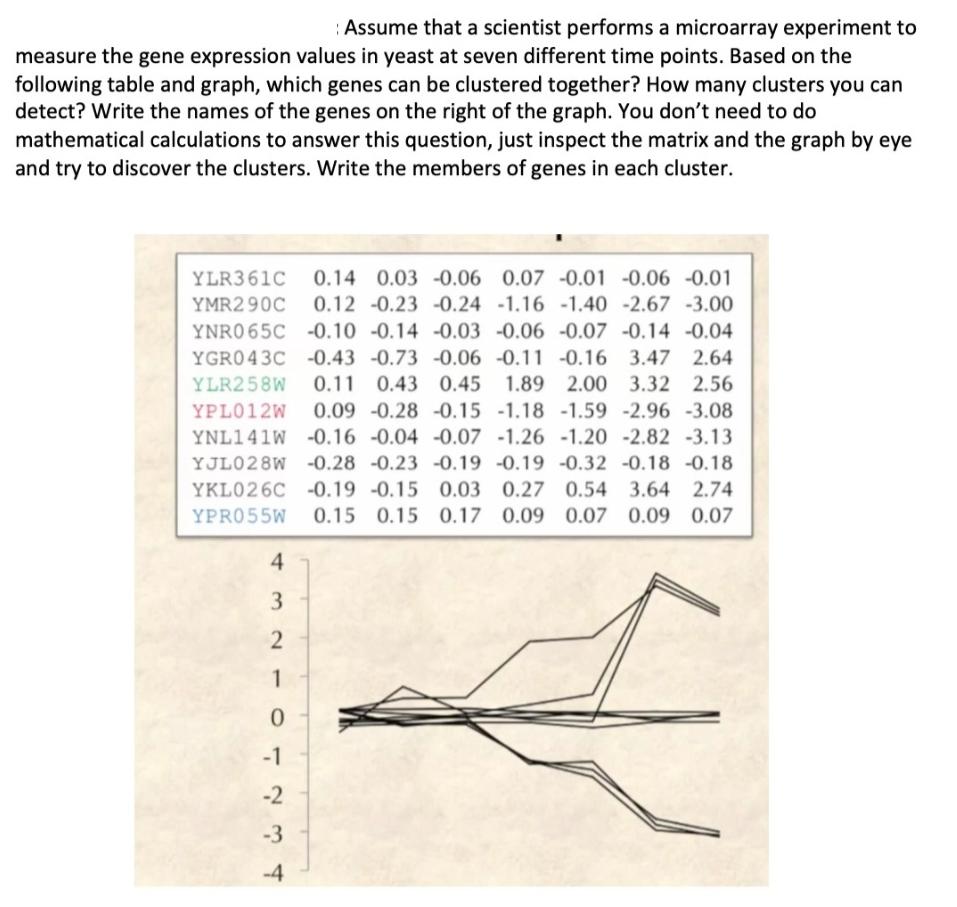
Assume that a scientist performs a microarray experiment to measure the gene expression values in yeast at seven different time points. Based on the following table and graph, which genes can be clustered together? How many clusters you can detect? Write the names of the genes on the right of the graph. You don't need to do mathematical calculations to answer this question, just inspect the matrix and the graph by eye and try to discover the clusters. Write the members of genes in each cluster. YLR361C 0.14 0.03 -0.06 0.07 -0.01 -0.06 -0.01 YMR290C 0.12 -0.23 -0.24 -1.16 -1.40 -2.67 -3.00 YNRO65C -0.10 -0.14 -0.03 -0.06 -0.07 -0.14 -0.04 YGR043C -0.43 -0.73 -0.06 -0.11 -0.16 3.47 2.64 YLR258W 0.11 0.43 0.45 1.89 2.00 3.32 2.56 YPL012W 0.09 -0.28 -0.15 -1.18 -1.59 -2.96 -3.08 YNL141W -0.16 -0.04 -0.07 -1.26 -1.20 -2.82 -3.13 YJL028W -0.28 -0.23 -0.19 0.19 -0.32 -0.18 -0.18 YKL026C -0.19 -0.15 0.03 0.27 0.54 3.64 2.74 YPR055W 0.15 0.15 0.17 0.09 0.07 0.09 0.07 4 3 2 1 0 -1 234
Step by Step Solution
3.44 Rating (154 Votes )
There are 3 Steps involved in it

Get step-by-step solutions from verified subject matter experts