

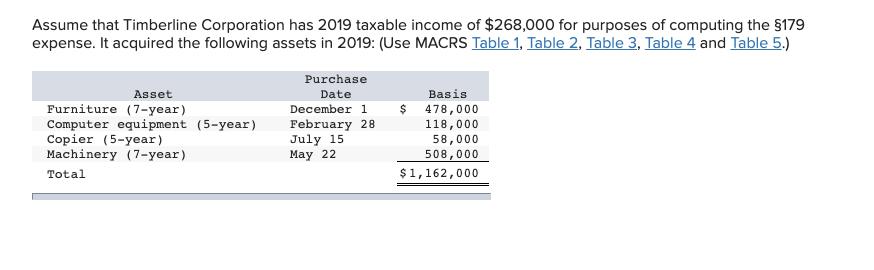
Assume that Timberline Corporation has 2019 taxable income of $268,000 for purposes of computing the $179...
Fantastic news! We've Found the answer you've been seeking!
Question:
Transcribed Image Text:
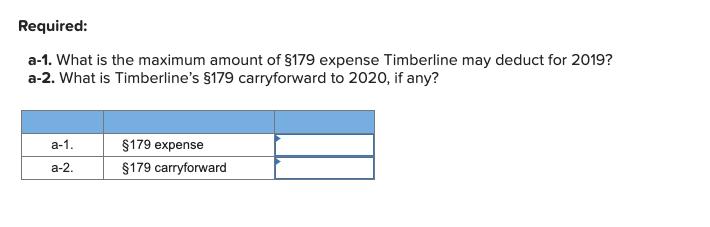
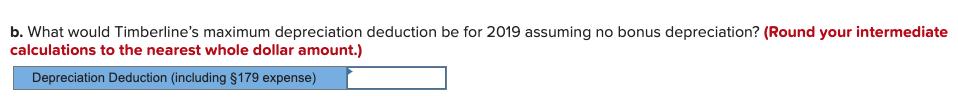
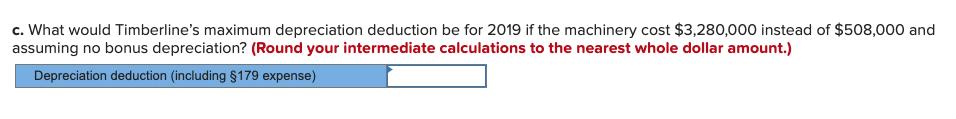
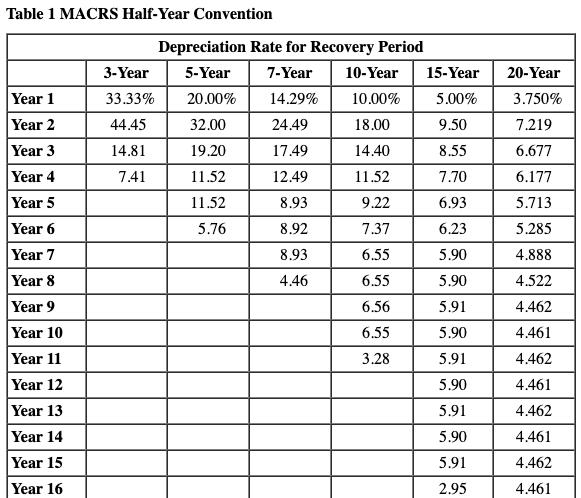
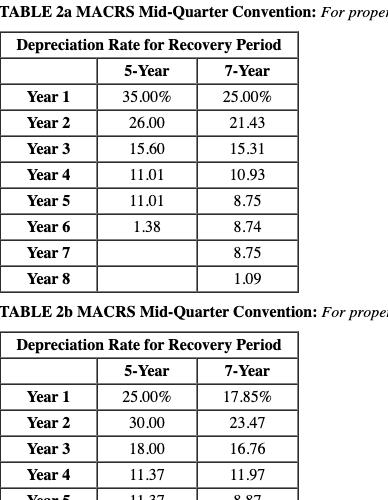
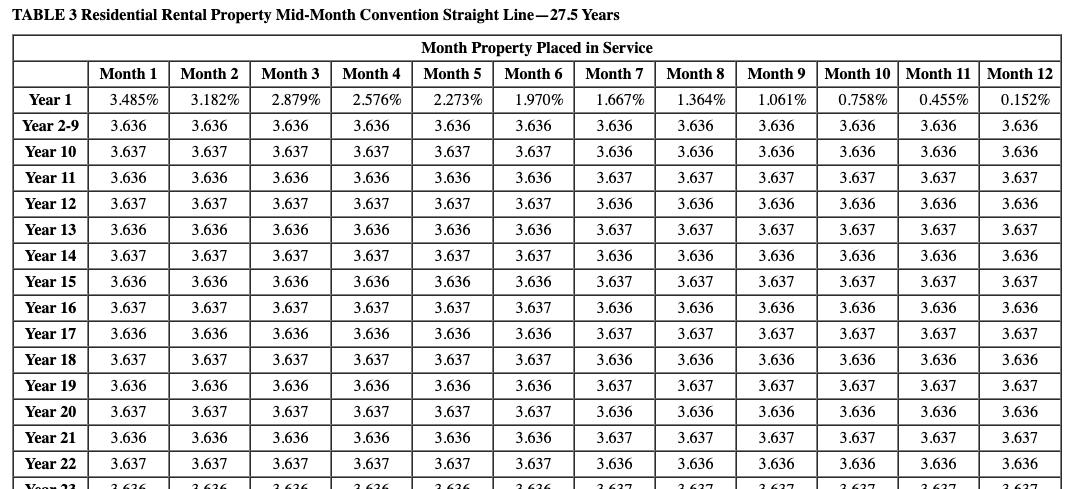
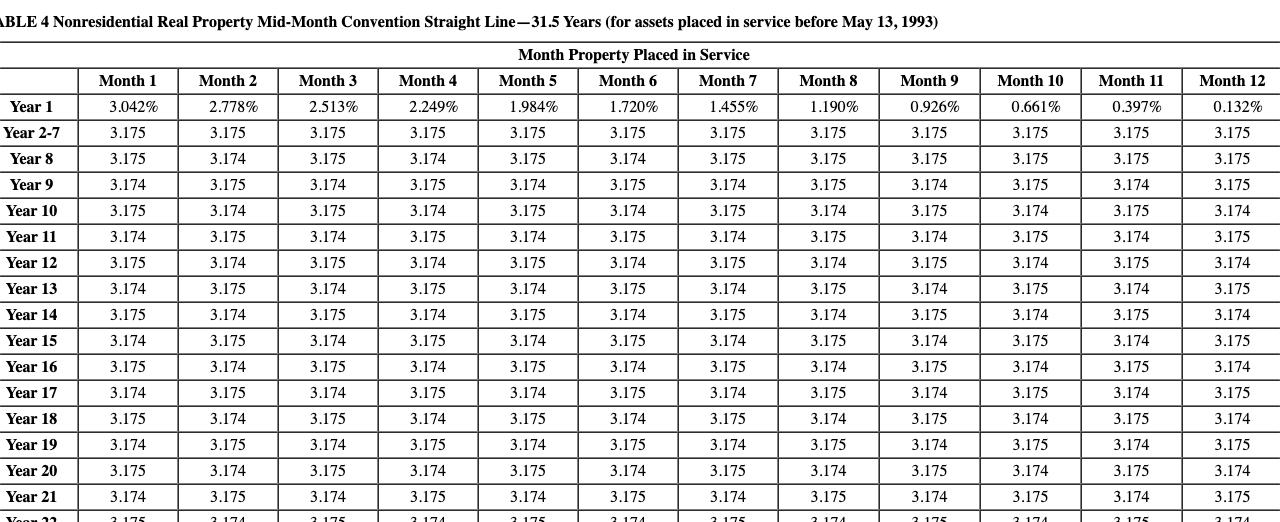
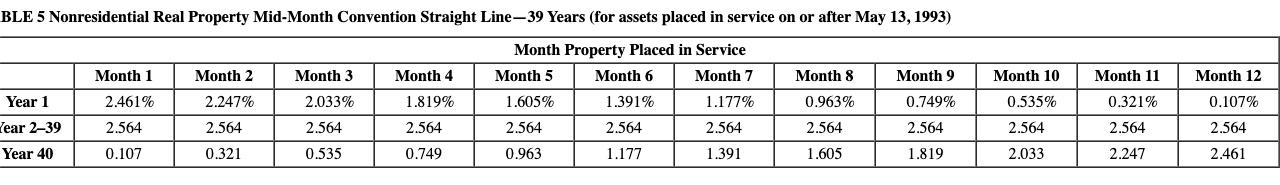
Assume that Timberline Corporation has 2019 taxable income of $268,000 for purposes of computing the $179 expense. It acquired the following assets in 2019: (Use MACRS Table 1, Table 2, Table 3, Table 4 and Table 5.) Purchase Asset Furniture (7-year) Date Basis December 1 $ 478,000 Computer equipment (5-year) Copier (5-year) Machinery (7-year) February 28 July 15 May 22 118,000 58,000 508,000 Total $1,162,000 Required: a-1. What is the maximum amount of $179 expense Timberline may deduct for 2019? a-2. What is Timberline's $179 carryforward to 2020, if any? a-1. $179 expense а-2. $179 carryforward b. What would Timberline's maximum depreciation deduction be for 2019 assuming no bonus depreciation? (Round your intermediate calculations to the nearest whole dollar amount.) Depreciation Deduction (including $179 expense) c. What would Timberline's maximum depreciation deduction be for 2019 if the machinery cost $3,280,000 instead of $508,000 and assuming no bonus depreciation? (Round your intermediate calculations to the nearest whole dollar amount.) Depreciation deduction (including $179 expense) Table 1 MACRS Half-Year Convention Depreciation Rate for Recovery Period 3-Year 5-Year 7-Year 10-Year 15-Year 20-Year Year 1 Year 2 33.33% 20.00% 14.29% 10.00% 5.00% 3.750% 44.45 32.00 24.49 18.00 9.50 7.219 Year 3 14.81 19.20 17.49 14.40 8.55 6.677 Year 4 7.41 11.52 12.49 11.52 7.70 6.177 Year 5 11.52 8.93 9.22 6.93 5.713 Year 6 Year 7 Year 8 5.76 8.92 7.37 6.23 5.285 8.93 6.55 5.90 4.888 4.46 6.55 5.90 4.522 Year 9 6.56 5.91 4.462 Year 10 Year 11 Year 12 6.55 5.90 4.461 3.28 5.91 4.462 5.90 4.461 Year 13 5.91 4.462 Year 14 5.90 4.461 Year 15 5.91 4.462 Year 16 2.95 4.461 TABLE 2a MACRS Mid-Quarter Convention: For proper Depreciation Rate for Recovery Period 5-Year 7-Year Year 1 35.00% 25.00% Year 2 26.00 21.43 Year 3 15.60 15.31 Year 4 11.01 10.93 Year 5 11.01 8.75 Year 6 1.38 8.74 Year 7 8.75 Year 8 1.09 TABLE 2b MACRS Mid-Quarter Convention: For prope Depreciation Rate for Recovery Period 5-Year 7-Year Year 1 25.00% 17.85% Year 2 30.00 23.47 Year 3 18.00 16.76 Year 4 11.37 11.97 Voom 11. 27 O 07 TABLE 3 Residential Rental Property Mid-Month Convention Straight Line-27.5 Years Month Property Placed in Service Month 1 Month 2 Month 3 Month 4 Month 5 Month 6 Month 7 Month 8 Month 9 Month 10 Month 11 Month 12 Year 1 3.485% 3.182% 2.879% 2.576% 2.273% 1.970% 1.667% 1.364% 1.061% 0.758% 0.455% 0.152% Year 2-9 3.636 3.636 3.636 3.636 3.636 3.636 3.636 3.636 3.636 3.636 3.636 3.636 Year 10 3.637 3.637 3.637 3.637 3.637 3.637 3.636 3.636 3.636 3.636 3.636 3.636 Year 11 3.636 3.636 3.636 3.636 3.636 3.636 3.637 3.637 3.637 3.637 3.637 3.637 Year 12 3.637 3.637 3.637 3.637 3.637 3.637 3.636 3.636 3.636 3.636 3.636 3.636 Year 13 3.636 3.636 3.636 3.636 3.636 3.636 3.637 3.637 3.637 3.637 3.637 3.637 Year 14 3.637 3.637 3.637 3.637 3.637 3.637 3.636 3.636 3.636 3.636 3.636 3.636 Year 15 3.636 3.636 3.636 3.636 3.636 3.636 3.637 3.637 3.637 3.637 3.637 3.637 Year 16 3.637 3.637 3.637 3.637 3.637 3.637 3.636 3.636 3.636 3.636 3.636 3.636 Year 17 3.636 3.636 3.636 3.636 3.636 3.636 3.637 3.637 3.637 3.637 3.637 3.637 Year 18 3.637 3.637 3.637 3.637 3.637 3.637 3.636 3.636 3.636 3.636 3.636 3.636 Year 19 3.636 3.636 3.636 3.636 3.636 3,636 3.637 3.637 3.637 3.637 3.637 3.637 Year 20 3.637 3.637 3.637 3.637 3.637 3.637 3.636 3.636 3.636 3.636 3.636 3.636 Year 21 3.636 3.636 3.636 3.636 3.636 3.636 3.637 3.637 3.637 3.637 3.637 3.637 Year 22 3.637 3.637 3.637 3.637 3.637 3.637 3.636 3.636 3.636 3.636 3.636 3.636 Yoon 13 3 636 1 636 3 636 3 636 3 636 1 636 3 627 1 67 3 627 3 637 3 637 3637 ABLE 4 Nonresidential Real Property Mid-Month Convention Straight Line-31.5 Years (for assets placed in service before May 13, 1993) Month Property Placed in Service Month 1 Month 2 Month 3 Month 4 Month 5 Month 6 Month 7 Month 8 Month 9 Month 10 Month 11 Month 12 Year 1 3.042% 2.778% 2.513% 2.249% 1.984% 1.720% 1.455% 1.190% 0.926% 0.661% 0.397% 0.132% Year 2-7 3.175 3.175 3.175 3.175 3.175 3.175 3.175 3.175 3.175 3.175 3.175 3.175 Year 8 3.175 3.174 3.175 3.174 3.175 3.174 3.175 3.175 3.175 3.175 3.175 3.175 Year 9 3.174 3.175 3.174 3.175 3.174 3.175 3,174 3.175 3.174 3.175 3.174 3.175 Year 10 3.175 3.174 3.175 3.174 3.175 3.174 3.175 3.174 3.175 3.174 3.175 3.174 Year 11 3.174 3.175 3.174 3.175 3.174 3.175 3.174 3.175 3.174 3.175 3.174 3.175 Year 12 3.175 3.174 3.175 3.174 3.175 3.174 3.175 3.174 3.175 3.174 3.175 3.174 Year 13 3.174 3.175 3.174 3.175 3.174 3.175 3.174 3.175 3.174 3.175 3.174 3.175 Year 14 3.175 3.174 3.175 3.174 3.175 3.174 3.175 3.174 3.175 3.174 3.175 3.174 Year 15 3.174 3.175 3.174 3.175 3.174 3.175 3.174 3.175 3.174 3.175 3.174 3.175 Year 16 3.175 3.174 3.175 3.174 3.175 3.174 3.175 3.174 3.175 3.174 3.175 3.174 Year 17 3.174 3.175 3.174 3.175 3.174 3,175 3.174 3.175 3.174 3.175 3.174 3.175 Year 18 3.175 3.174 3.175 3.174 3.175 3.174 3.175 3.174 3.175 3.174 3.175 3.174 Year 19 3.174 3.175 3.174 3.175 3.174 3.175 3.174 3.175 3.174 3.175 3.174 3.175 Year 20 3.175 3.174 3.175 3.174 3.175 3.174 3.175 3.174 3.175 3.174 3.175 3.174 Year 21 3.174 3.175 3.174 3.175 3.174 3.175 3.174 3.175 3.174 3.175 3.174 3.175 Yoou 11 2 175 2 174 1 175 1 174 3 174 1 175 3 174 7 175 2 174 2 175 2 174 2175 BLE 5 Nonresidential Real Property Mid-Month Convention Straight Line-39 Years (for assets placed in service on or after May 13, 1993) Month Property Placed in Service Month 1 Month 2 Month 3 Month 4 Month 5 Month 6 Month 7 Month 8 Month 9 Month 10 Month 11 Month 12 Year 1 2.461% 2.247% 2.033% 1.819% 1.605% 1.391% 1.177% 0.963% 0.749% 0,535% 0.321% 0.107% Tear 2-39 2.564 2.564 2.564 2.564 2.564 2.564 2.564 2.564 2.564 2.564 2.564 2.564 Year 40 0.107 0.321 0.535 0.749 0.963 1.177 1.391 1.605 1.819 2.033 2.247 2.461 Assume that Timberline Corporation has 2019 taxable income of $268,000 for purposes of computing the $179 expense. It acquired the following assets in 2019: (Use MACRS Table 1, Table 2, Table 3, Table 4 and Table 5.) Purchase Asset Furniture (7-year) Date Basis December 1 $ 478,000 Computer equipment (5-year) Copier (5-year) Machinery (7-year) February 28 July 15 May 22 118,000 58,000 508,000 Total $1,162,000 Required: a-1. What is the maximum amount of $179 expense Timberline may deduct for 2019? a-2. What is Timberline's $179 carryforward to 2020, if any? a-1. $179 expense а-2. $179 carryforward b. What would Timberline's maximum depreciation deduction be for 2019 assuming no bonus depreciation? (Round your intermediate calculations to the nearest whole dollar amount.) Depreciation Deduction (including $179 expense) c. What would Timberline's maximum depreciation deduction be for 2019 if the machinery cost $3,280,000 instead of $508,000 and assuming no bonus depreciation? (Round your intermediate calculations to the nearest whole dollar amount.) Depreciation deduction (including $179 expense) Table 1 MACRS Half-Year Convention Depreciation Rate for Recovery Period 3-Year 5-Year 7-Year 10-Year 15-Year 20-Year Year 1 Year 2 33.33% 20.00% 14.29% 10.00% 5.00% 3.750% 44.45 32.00 24.49 18.00 9.50 7.219 Year 3 14.81 19.20 17.49 14.40 8.55 6.677 Year 4 7.41 11.52 12.49 11.52 7.70 6.177 Year 5 11.52 8.93 9.22 6.93 5.713 Year 6 Year 7 Year 8 5.76 8.92 7.37 6.23 5.285 8.93 6.55 5.90 4.888 4.46 6.55 5.90 4.522 Year 9 6.56 5.91 4.462 Year 10 Year 11 Year 12 6.55 5.90 4.461 3.28 5.91 4.462 5.90 4.461 Year 13 5.91 4.462 Year 14 5.90 4.461 Year 15 5.91 4.462 Year 16 2.95 4.461 TABLE 2a MACRS Mid-Quarter Convention: For proper Depreciation Rate for Recovery Period 5-Year 7-Year Year 1 35.00% 25.00% Year 2 26.00 21.43 Year 3 15.60 15.31 Year 4 11.01 10.93 Year 5 11.01 8.75 Year 6 1.38 8.74 Year 7 8.75 Year 8 1.09 TABLE 2b MACRS Mid-Quarter Convention: For prope Depreciation Rate for Recovery Period 5-Year 7-Year Year 1 25.00% 17.85% Year 2 30.00 23.47 Year 3 18.00 16.76 Year 4 11.37 11.97 Voom 11. 27 O 07 TABLE 3 Residential Rental Property Mid-Month Convention Straight Line-27.5 Years Month Property Placed in Service Month 1 Month 2 Month 3 Month 4 Month 5 Month 6 Month 7 Month 8 Month 9 Month 10 Month 11 Month 12 Year 1 3.485% 3.182% 2.879% 2.576% 2.273% 1.970% 1.667% 1.364% 1.061% 0.758% 0.455% 0.152% Year 2-9 3.636 3.636 3.636 3.636 3.636 3.636 3.636 3.636 3.636 3.636 3.636 3.636 Year 10 3.637 3.637 3.637 3.637 3.637 3.637 3.636 3.636 3.636 3.636 3.636 3.636 Year 11 3.636 3.636 3.636 3.636 3.636 3.636 3.637 3.637 3.637 3.637 3.637 3.637 Year 12 3.637 3.637 3.637 3.637 3.637 3.637 3.636 3.636 3.636 3.636 3.636 3.636 Year 13 3.636 3.636 3.636 3.636 3.636 3.636 3.637 3.637 3.637 3.637 3.637 3.637 Year 14 3.637 3.637 3.637 3.637 3.637 3.637 3.636 3.636 3.636 3.636 3.636 3.636 Year 15 3.636 3.636 3.636 3.636 3.636 3.636 3.637 3.637 3.637 3.637 3.637 3.637 Year 16 3.637 3.637 3.637 3.637 3.637 3.637 3.636 3.636 3.636 3.636 3.636 3.636 Year 17 3.636 3.636 3.636 3.636 3.636 3.636 3.637 3.637 3.637 3.637 3.637 3.637 Year 18 3.637 3.637 3.637 3.637 3.637 3.637 3.636 3.636 3.636 3.636 3.636 3.636 Year 19 3.636 3.636 3.636 3.636 3.636 3,636 3.637 3.637 3.637 3.637 3.637 3.637 Year 20 3.637 3.637 3.637 3.637 3.637 3.637 3.636 3.636 3.636 3.636 3.636 3.636 Year 21 3.636 3.636 3.636 3.636 3.636 3.636 3.637 3.637 3.637 3.637 3.637 3.637 Year 22 3.637 3.637 3.637 3.637 3.637 3.637 3.636 3.636 3.636 3.636 3.636 3.636 Yoon 13 3 636 1 636 3 636 3 636 3 636 1 636 3 627 1 67 3 627 3 637 3 637 3637 ABLE 4 Nonresidential Real Property Mid-Month Convention Straight Line-31.5 Years (for assets placed in service before May 13, 1993) Month Property Placed in Service Month 1 Month 2 Month 3 Month 4 Month 5 Month 6 Month 7 Month 8 Month 9 Month 10 Month 11 Month 12 Year 1 3.042% 2.778% 2.513% 2.249% 1.984% 1.720% 1.455% 1.190% 0.926% 0.661% 0.397% 0.132% Year 2-7 3.175 3.175 3.175 3.175 3.175 3.175 3.175 3.175 3.175 3.175 3.175 3.175 Year 8 3.175 3.174 3.175 3.174 3.175 3.174 3.175 3.175 3.175 3.175 3.175 3.175 Year 9 3.174 3.175 3.174 3.175 3.174 3.175 3,174 3.175 3.174 3.175 3.174 3.175 Year 10 3.175 3.174 3.175 3.174 3.175 3.174 3.175 3.174 3.175 3.174 3.175 3.174 Year 11 3.174 3.175 3.174 3.175 3.174 3.175 3.174 3.175 3.174 3.175 3.174 3.175 Year 12 3.175 3.174 3.175 3.174 3.175 3.174 3.175 3.174 3.175 3.174 3.175 3.174 Year 13 3.174 3.175 3.174 3.175 3.174 3.175 3.174 3.175 3.174 3.175 3.174 3.175 Year 14 3.175 3.174 3.175 3.174 3.175 3.174 3.175 3.174 3.175 3.174 3.175 3.174 Year 15 3.174 3.175 3.174 3.175 3.174 3.175 3.174 3.175 3.174 3.175 3.174 3.175 Year 16 3.175 3.174 3.175 3.174 3.175 3.174 3.175 3.174 3.175 3.174 3.175 3.174 Year 17 3.174 3.175 3.174 3.175 3.174 3,175 3.174 3.175 3.174 3.175 3.174 3.175 Year 18 3.175 3.174 3.175 3.174 3.175 3.174 3.175 3.174 3.175 3.174 3.175 3.174 Year 19 3.174 3.175 3.174 3.175 3.174 3.175 3.174 3.175 3.174 3.175 3.174 3.175 Year 20 3.175 3.174 3.175 3.174 3.175 3.174 3.175 3.174 3.175 3.174 3.175 3.174 Year 21 3.174 3.175 3.174 3.175 3.174 3.175 3.174 3.175 3.174 3.175 3.174 3.175 Yoou 11 2 175 2 174 1 175 1 174 3 174 1 175 3 174 7 175 2 174 2 175 2 174 2175 BLE 5 Nonresidential Real Property Mid-Month Convention Straight Line-39 Years (for assets placed in service on or after May 13, 1993) Month Property Placed in Service Month 1 Month 2 Month 3 Month 4 Month 5 Month 6 Month 7 Month 8 Month 9 Month 10 Month 11 Month 12 Year 1 2.461% 2.247% 2.033% 1.819% 1.605% 1.391% 1.177% 0.963% 0.749% 0,535% 0.321% 0.107% Tear 2-39 2.564 2.564 2.564 2.564 2.564 2.564 2.564 2.564 2.564 2.564 2.564 2.564 Year 40 0.107 0.321 0.535 0.749 0.963 1.177 1.391 1.605 1.819 2.033 2.247 2.461
Expert Answer:
Answer rating: 100% (QA)
Furniture 7 year depreciation 1429 cost of furniture 478000 Depreciatio... View the full answer

Related Book For 
Essentials of Federal Taxation 2019
ISBN: 9781260190045
10th edition
Authors: Brian Spilker, Benjamin Ayers, John Robinson, Edmund Outslay, Ronald Worsham, John Barrick, Connie Weaver
Posted Date:
Students also viewed these accounting questions
-
Assume that Timberline Corporation has 2015 taxable income of $240,000 before the §179 expense (assume the 2014 §179 limits are extended to 2015). a) What is the maximum amount of §179...
-
Assume that Timberline Corporation has 2018 taxable income of $240,000 for purposes of computing the §179 expense. It acquired the following assets in 2018: a. What is the maximum amount of...
-
Assume that Timberline Corporation has 2014taxable income of $240,000 before the 179 expense (assume the 2013 179 limits are extended to 2014). Asset Purchase Date Basis Furniture (7-year)...
-
Simplify the given expressions. Express all answers with positive exponents. 25/7/7/4 2/3 a
-
Consider a sphere of radius r. What is the length of a side of a cube that has the same surface area as the sphere?
-
A planned fleet of forklift trucks has an average travel distance per delivery = 500 ft loaded and an average empty travel distance = 350 ft. The fleet must make a total of 60 deliveries per hour....
-
Why can patterns be labeled experienced reuse?
-
A problem often discussed in the engineering economy literature is the "oil-well pump problem"} Pump 1is a small pump; Pump 2 is a larger pump that costs more, will produce slightly more oil, and...
-
On January 1, 2022, Halstead, Incorporated, purchased 71,000 shares of Sedgwick Company common stock for $1,554,000, giving Halstead 25 percent ownership and the ability to apply significant...
-
Should Grand Central Publishing continue to bid for Dewey, wait for the scheduled auction with several interested publishers, or pull out of the race? Why? 2. What is the role of authors, agents, and...
-
Dog Behavioral Problems Have you had a dog with a behavioral problem? Tell us about him or her Clickers What basic behavioral principles are in play when using clickers to train dogs?
-
6. Show the diagram of Program Execution for the following instruction. (20 marks) 2-Store 5- Add a. Instruction Code: 1- Fetch b. Memory holds 6-Sub Instruction: 1-455 5-456 6-455 2-455 c. Show the...
-
1. We consider trying to draw Qk graphs on surfaces. A. Show that Q3 can be drawn on the plane without edges crossing. The quickest way is to actually draw it. B. Use the fact that Q4 has no...
-
The linearized equations of perturbed longitudinal motion for a given flight condition are given (in SI units) by: u=200.00 +0.035a-9.810-0.18u q=-0.65q-0.25-a-1.28 =q-0.25u-0.6a-0.0356 1) Determine...
-
A passive and chemically inert pollutant is emitted from a chimney of height h (= 120 m) and diameter d (= 0.8 m) into the atmosphere of ambient temperature T. (= 298 K). The pollutant emission rate,...
-
2D crystal A3B (blue for A and yellow for B) is shown in the following figure. 1. Can you find 6-fold rotational symmetry? Can you find mirror symmetry? If yes, plot one rotation center/mirror line....
-
Barnes Company reports the following for its product for its first year of operations. Direct materials Direct labor Variable overhead Fixed overhead Variable selling and administrative expenses...
-
Continuation of Exercise 4-83. (a) What is the probability that the first major crack occurs between 12 and 15 miles of the start of inspection? (b) What is the probability that there are no major...
-
Tiffany is unmarried and has a 15-year-old qualifying child. Tiffany has determined her tax liability to be $3,525, and her employer has withheld $1,500 of federal taxes from her paycheck. Tiffany is...
-
Tremaine would like to organize UTA as either an S Corporation or a C corporation. In either form, the entity will generate a 9 percent annual before tax return on a $1,000,000 investment. Tremaines...
-
Andrea would like to organize SHO as either an LLC (taxed as a sole proprietorship) or a C corporation. In either form, the entity is expected to generate an 11 percent annual before-tax return on a...
-
This exercise considers the data described in the Section 13.2.2 ratemaking classification example using data in Table 13.3 Table 13.3 . a. Fit a gamma regression model using a log-link function with...
-
This exercise considers data from the Medical Expenditure Panel Survey (MEPS) described in Exercise 1.1 and Section 11.4. Our dependent variable consists of the number of outpatient (COUNTOP) visits....
-
Verify that the Tweedie distribution is a member of the linear exponential family of distributions by checking equation (13.9). In particular, provide an expression for \(S(y, \phi)\) (note that...

Study smarter with the SolutionInn App