

Question: Assume we are given the formula: S(t + 1) = rS(t) where r 0. We want to investigate the long term behaviors of the system
Assume we are given the formula:
S(t + 1) = rS(t)
where r 0. We want to investigate the long term behaviors of the system under different conditions as follows:
Case 1: r > 1, S(0) = 0.5
Case 2: r > 1, S(0) = -0.5
Case 3: 0
Case 4: 0
Case 5: -1
Case 6: -1
Case 7: r
Case 8: r
Task1:
At first, use rand() to generate a random number between 1 and 2 as the value for r in case 1. Generate 1000 data points by using S(t + 1) = rS(t), similar to what I showed in class. Plot an X-Y chart for these 1000 data points.
Task2:
At first, use rand() to generate a random number between 1 and 2 as the value for r in case 2. Generate 1000 data points by using S(t + 1) = rS(t), similar to what I showed in class. Plot an X-Y chart for these 1000 data points.
Task3:
At first, use rand() to generate a random number between 0 and 1 as the value for r in case 3. Generate 1000 data points by using S(t + 1) = rS(t), similar to what I showed in class. Plot an X-Y chart for these 1000 data points.
Task4:
At first, use rand() to generate a random number between 0 and 1 as the value for r in case 4. Generate 1000 data points by using S(t + 1) = rS(t), similar to what I showed in class. Plot an X-Y chart for these 1000 data points.
Task5:
At first, use rand() to generate a random number between 0 and -1 as the value for r in case 1. Generate 1000 data points by using S(t + 1) = rS(t), similar to what I showed in class. Plot an X-Y chart for these 1000 data points.
Task6:
At first, use rand() to generate a random number between 0 and -1 as the value for r in case 1. Generate 1000 data points by using S(t + 1) = rS(t), similar to what I showed in class. Plot an X-Y chart for these 1000 data points.
Task7:
At first, use rand() to generate a random number between -1 and -2 as the value for r in case 1. Generate 1000 data points by using S(t + 1) = rS(t), similar to what I showed in class. Plot an X-Y chart for these 1000 data points.
Task8:
At first, use rand() to generate a random number between -1 and -2 as the value for r in case 1. Generate 1000 data points by using S(t + 1) = rS(t), similar to what I showed in class. Plot an X-Y chart for these 1000 data points.
Task 9
Describe and compare behaviors of the system for
(i) r > 1,
(ii) 0
(iii) -1
(iv) r
See picture for hint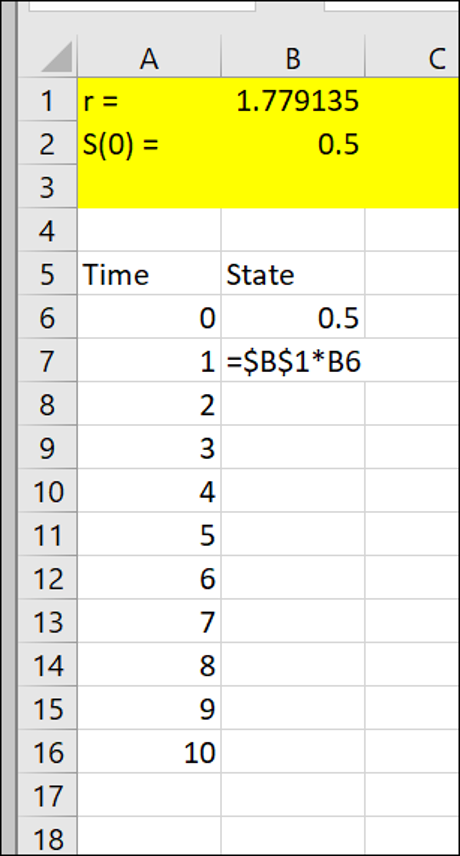
A C 1 r= 2 S(O) = 3 B 1.779135 0.5 4 5 Time 6 State 0 0.5 1 =$B$1*B6 2 7 8 9 3 10 4 11 12 13 14 Bodo vou 8 15 16 17 18
Step by Step Solution
There are 3 Steps involved in it

Get step-by-step solutions from verified subject matter experts