Question: Would prefer if this could be done on an excel sheet I can download to see. But whatever is easier. Thanks Updang_csustan_edu/_layouts/15/Doc.aspx?sourcedoc=%7BC039860D-4C4E-48F1-8664-4E5DFOAAA414957D&file proj 2 S2021
Would prefer if this could be done on an excel sheet I can download to see. But whatever is easier. Thanks
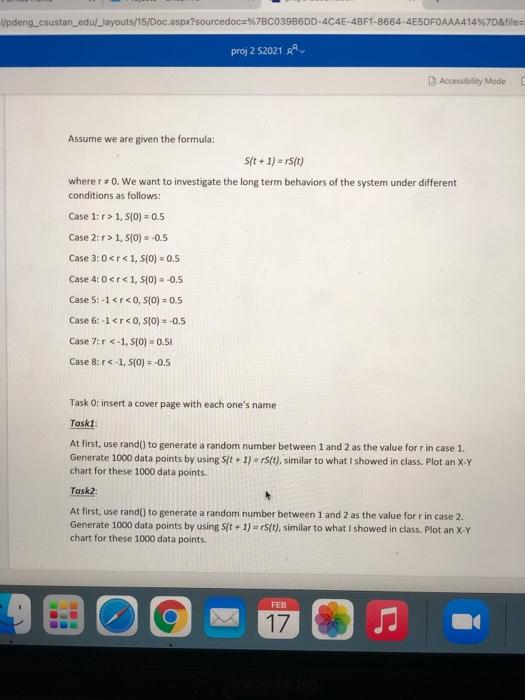
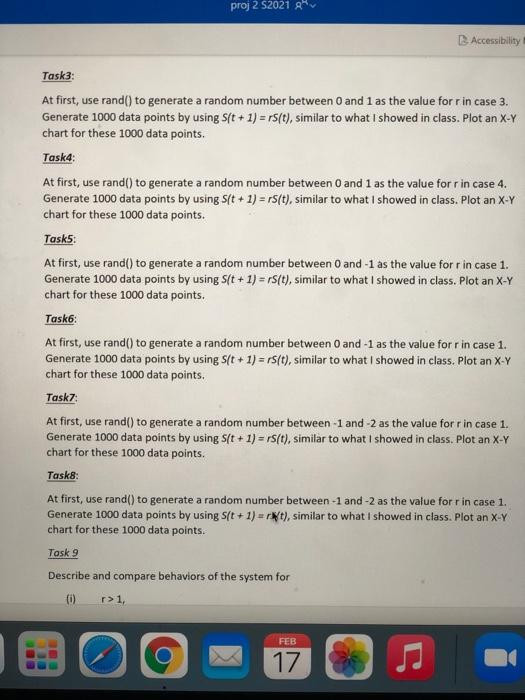
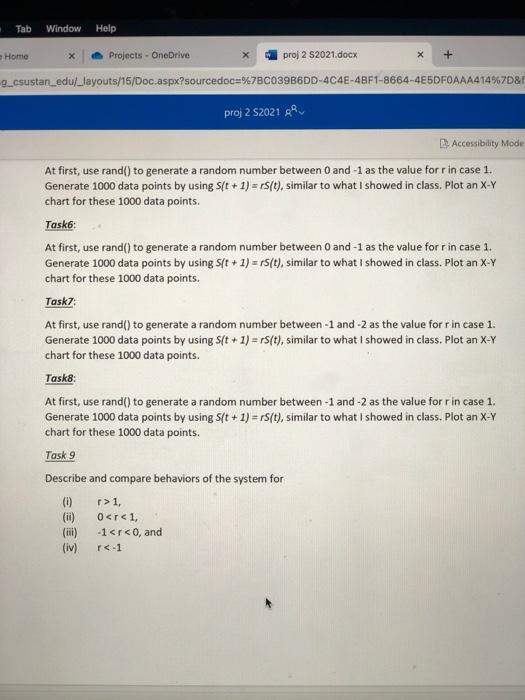
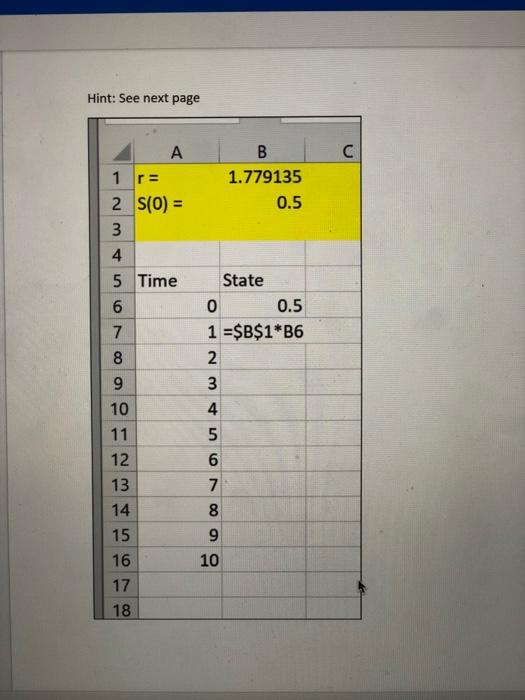
Updang_csustan_edu/_layouts/15/Doc.aspx?sourcedoc=%7BC039860D-4C4E-48F1-8664-4E5DFOAAA414957D&file proj 2 S2021 RR Accessibility Mode Assume we are given the formula: s(t + 1) = 5(0) wherer #0. We want to investigate the long term behaviors of the system under different conditions as follows: Case 1:r> 1, S(0) = 0.5 Case 2:r> 1, S(O) = -0.5 Case 3:01 FEB 3 17 Tab Window Help Home Projects - OneDrive proj 2 S2021.docx X + g_csustan_edu/_jayouts/15/Doc.aspx?sourcedocu%7BC039B6DD-4C4E-48F1-8664-4E5DFOAAA414%7D& proj 2 S2021 g Accessibility Mode At first, use rand() to generate a random number between 0 and -1 as the value for r in case 1. Generate 1000 data points by using s(t+1) = r(t), similar to what I showed in class. Plot an X-Y chart for these 1000 data points. Taske At first, use rand() to generate a random number between 0 and -1 as the value for r in case 1. Generate 1000 data points by using S(t + 1) = 15(t), similar to what I showed in class. Plot an X-Y chart for these 1000 data points. Task At first, use rand() to generate a random number between-1 and -2 as the value for r in case 1. Generate 1000 data points by using S(t + 1) = r(t), similar to what I showed in class. Plot an X-Y chart for these 1000 data points. Tasks: At first, use rand() to generate a random number between-1 and -2 as the value for r in case 1. Generate 1000 data points by using st +1) = rs(t), similar to what I showed in class. Plot an X-Y chart for these 1000 data points. Task 2 Describe and compare behaviors of the system for (1) r>1, O 1, S(0) = 0.5 Case 2:r> 1, S(O) = -0.5 Case 3:01 FEB 3 17 Tab Window Help Home Projects - OneDrive proj 2 S2021.docx X + g_csustan_edu/_jayouts/15/Doc.aspx?sourcedocu%7BC039B6DD-4C4E-48F1-8664-4E5DFOAAA414%7D& proj 2 S2021 g Accessibility Mode At first, use rand() to generate a random number between 0 and -1 as the value for r in case 1. Generate 1000 data points by using s(t+1) = r(t), similar to what I showed in class. Plot an X-Y chart for these 1000 data points. Taske At first, use rand() to generate a random number between 0 and -1 as the value for r in case 1. Generate 1000 data points by using S(t + 1) = 15(t), similar to what I showed in class. Plot an X-Y chart for these 1000 data points. Task At first, use rand() to generate a random number between-1 and -2 as the value for r in case 1. Generate 1000 data points by using S(t + 1) = r(t), similar to what I showed in class. Plot an X-Y chart for these 1000 data points. Tasks: At first, use rand() to generate a random number between-1 and -2 as the value for r in case 1. Generate 1000 data points by using st +1) = rs(t), similar to what I showed in class. Plot an X-Y chart for these 1000 data points. Task 2 Describe and compare behaviors of the system for (1) r>1, O