

Question: Assumptions for problems a-f: A pension fund manager is considering three mutual funds. The first is a stock fund, the second is a long-term government
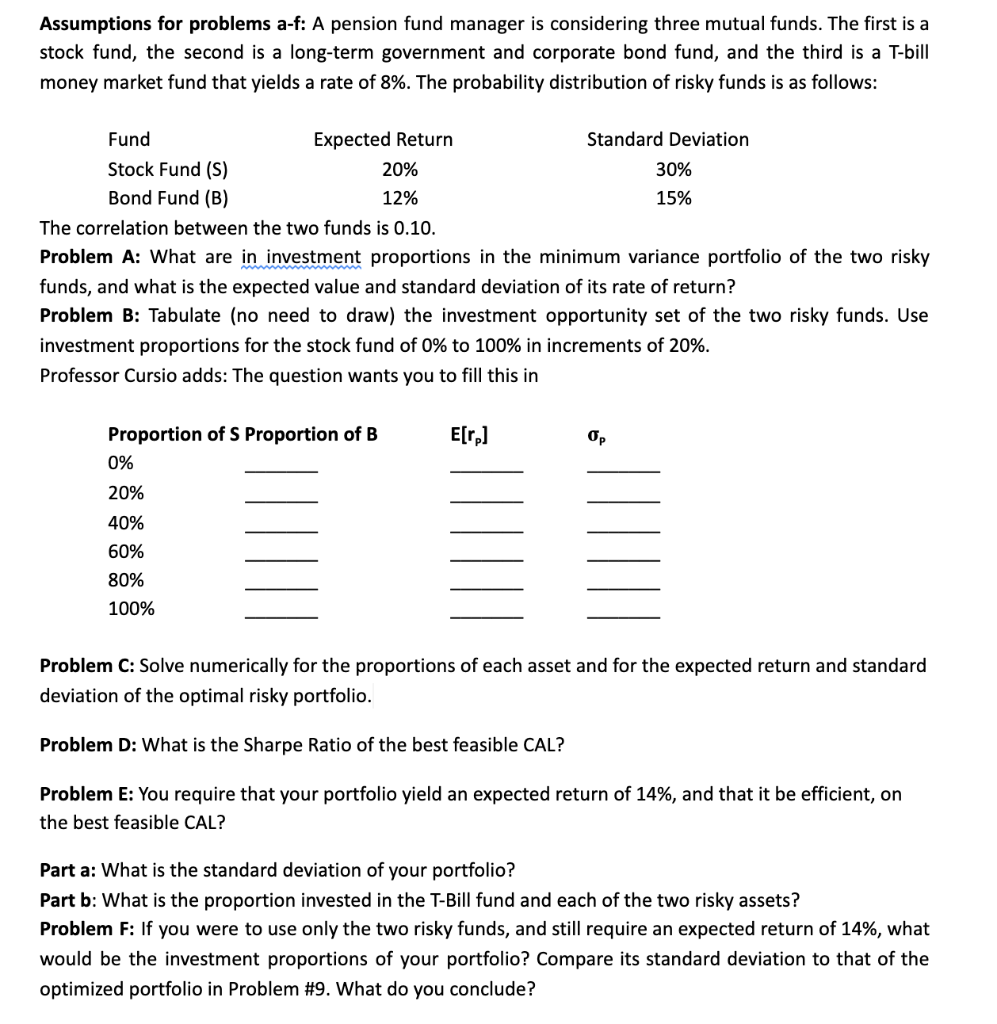
Assumptions for problems a-f: A pension fund manager is considering three mutual funds. The first is a stock fund, the second is a long-term government and corporate bond fund, and the third is a T-bill money market fund that yields a rate of 8%. The probability distribution of risky funds is as follows: Fund Expected Return Standard Deviation Stock Fund (S) 20% 30% Bond Fund (B) 12% 15% The correlation between the two funds is 0.10. Problem A: What are in investment proportions in the minimum variance portfolio of the two risky funds, and what is the expected value and standard deviation of its rate of return? Problem B: Tabulate (no need to draw) the investment opportunity set of the two risky funds. Use investment proportions for the stock fund of 0% to 100% in increments of 20%. Professor Cursio adds: The question wants you to fill this in E[r] Op Proportion of S Proportion of B 0% 20% 40% 60% 80% 100% Problem C: Solve numerically for the proportions of each asset and for the expected return and standard deviation of the optimal risky portfolio. Problem D: What is the Sharpe Ratio of the best feasible CAL? Problem E: You require that your portfolio yield an expected return of 14%, and that it be efficient, on the best feasible CAL? Part a: What is the standard deviation of your portfolio? Part b: What is the proportion invested in the T-Bill fund and each of the two risky assets? Problem F: If you were to use only the two risky funds, and still require an expected return of 14%, what would be the investment proportions of your portfolio? Compare its standard deviation to that of the optimized portfolio in Problem #9. What do you conclude? Assumptions for problems a-f: A pension fund manager is considering three mutual funds. The first is a stock fund, the second is a long-term government and corporate bond fund, and the third is a T-bill money market fund that yields a rate of 8%. The probability distribution of risky funds is as follows: Fund Expected Return Standard Deviation Stock Fund (S) 20% 30% Bond Fund (B) 12% 15% The correlation between the two funds is 0.10. Problem A: What are in investment proportions in the minimum variance portfolio of the two risky funds, and what is the expected value and standard deviation of its rate of return? Problem B: Tabulate (no need to draw) the investment opportunity set of the two risky funds. Use investment proportions for the stock fund of 0% to 100% in increments of 20%. Professor Cursio adds: The question wants you to fill this in E[r] Op Proportion of S Proportion of B 0% 20% 40% 60% 80% 100% Problem C: Solve numerically for the proportions of each asset and for the expected return and standard deviation of the optimal risky portfolio. Problem D: What is the Sharpe Ratio of the best feasible CAL? Problem E: You require that your portfolio yield an expected return of 14%, and that it be efficient, on the best feasible CAL? Part a: What is the standard deviation of your portfolio? Part b: What is the proportion invested in the T-Bill fund and each of the two risky assets? Problem F: If you were to use only the two risky funds, and still require an expected return of 14%, what would be the investment proportions of your portfolio? Compare its standard deviation to that of the optimized portfolio in Problem #9. What do you conclude
Step by Step Solution
There are 3 Steps involved in it

Get step-by-step solutions from verified subject matter experts