

Question: At date t, a trader buys a butterfly spread using three European call options on the same stock. The date t stock price is $27.50
At date t, a trader buys a butterfly spread using three European call options on the same stock. The date t stock price is $27.50 per share. All three options have the same expiration date, T. The first call option is priced at $7.75 per share and has a strike price equal to $20 per share, the second call option is priced at $2.07 per share and has a strike price equal to $27.50 per share, and the third call option is priced at $0.24 per share and has a strike price equal to $35 per share. At date T, what are the break-even stock prices per share?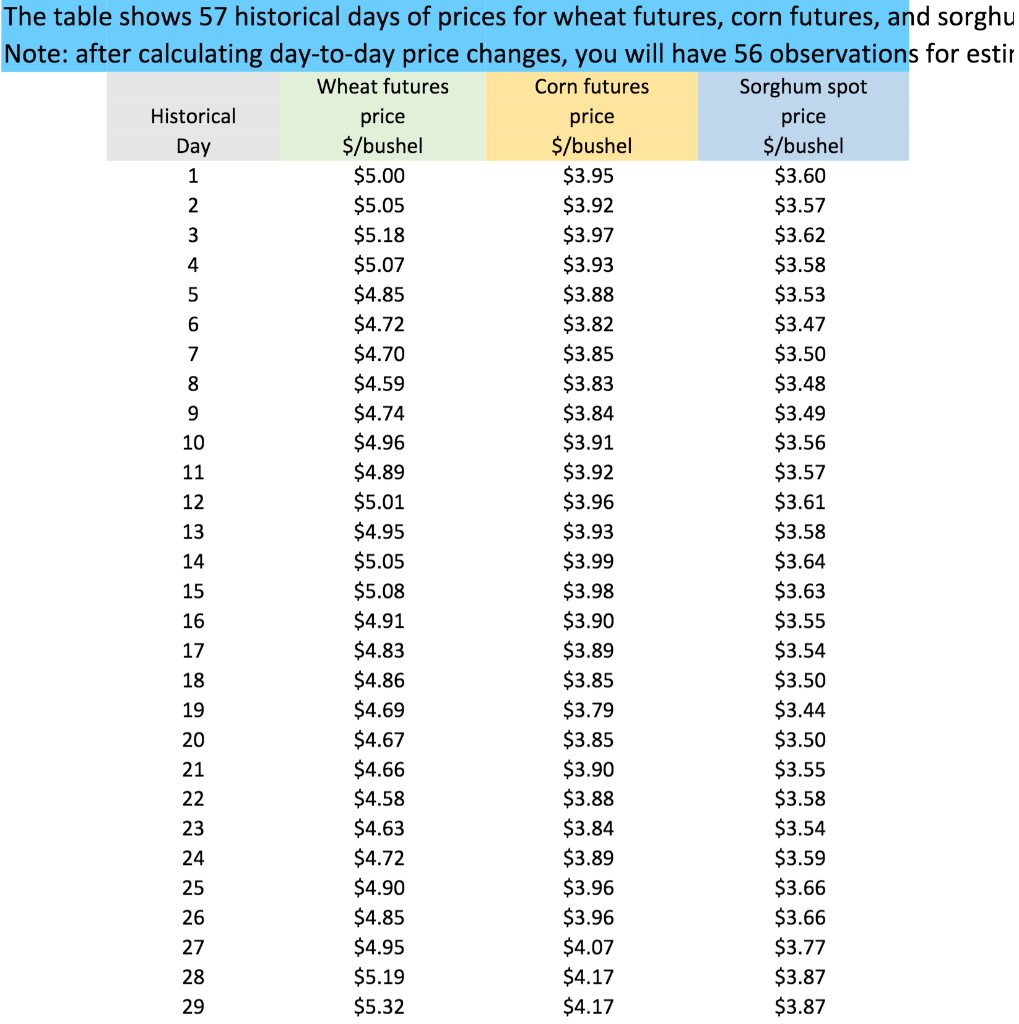
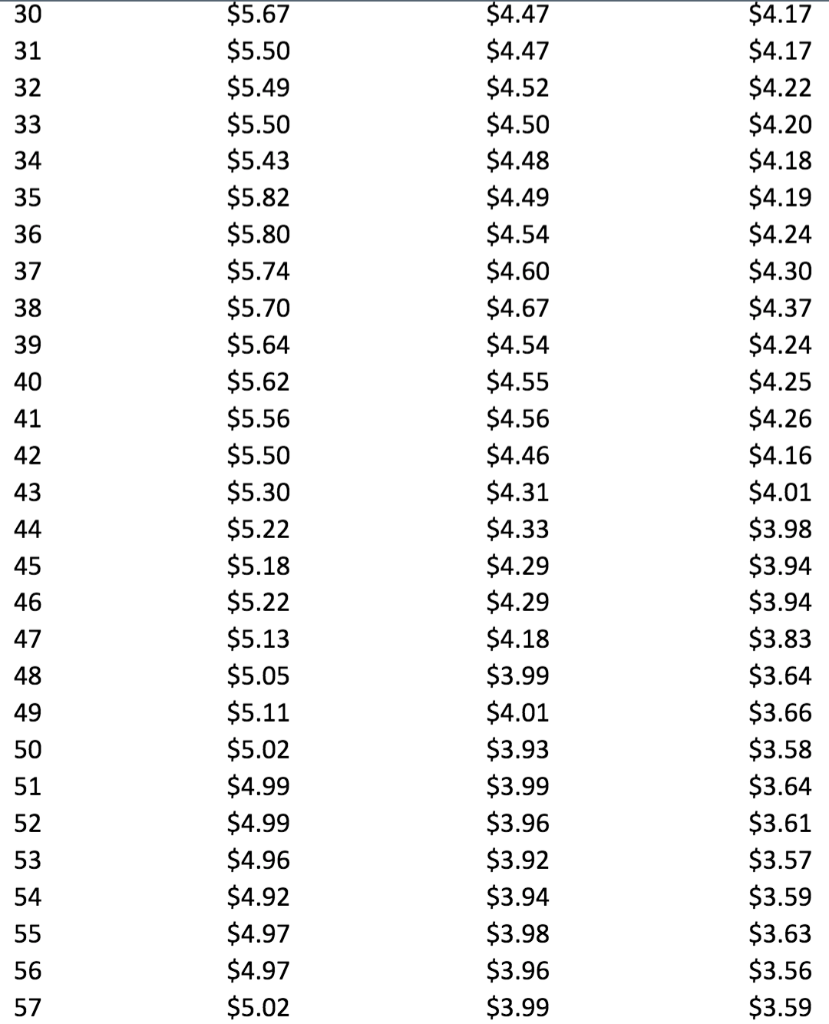
The table shows 57 historical days of prices for wheat futures, corn futures, and sorghu Note: after calculating day-to-day price changes, you will have 56 observations for estir Wheat futures Corn futures Sorghum spot Historical price price price Day $/bushel $/bushel $/bushel 1 $5.00 $3.95 $3.60 2 $5.05 $3.92 $3.57 3 $5.18 $3.97 $3.62 4 $5.07 $3.93 $3.58 5 $4.85 $3.88 $3.53 6 $4.72 $3.82 $3.47 7 $4.70 $3.85 $3.50 8 $4.59 $3.83 $3.48 9 $4.74 $3.84 $3.49 10 $4.96 $3.91 $3.56 11 $4.89 $3.92 $3.57 12 $5.01 $3.96 $3.61 13 $4.95 $3.93 $3.58 14 $5.05 $3.99 $3.64 15 $5.08 $3.98 $3.63 16 $4.91 $3.90 $3.55 17 $4.83 $3.89 $3.54 18 $4.86 $3.85 $3.50 19 $4.69 $3.79 $3.44 20 $4.67 $3.85 $3.50 21 $4.66 $3.90 $3.55 22 $4.58 $3.88 $3.58 23 $4.63 $3.84 $3.54 24 $4.72 $3.89 $3.59 25 $4.90 $3.96 $3.66 26 $4.85 $3.96 $3.66 27 $4.95 $4.07 $3.77 28 $5.19 $4.17 $3.87 29 $5.32 $4.17 $3.87 30 31 32 33 34 35 36 37 38 39 40 41 42 43 $5.67 $5.50 $5.49 $5.50 $5.43 $5.82 $5.80 $5.74 $5.70 $5.64 $5.62 $5.56 $5.50 $5.30 $5.22 $5.18 $5.22 $5.13 $5.05 $5.11 $5.02 $4.99 $4.99 $4.96 $4.92 $4.97 $4.97 $5.02 $4.47 $4.47 $4.52 $4.50 $4.48 $4.49 $4.54 $4.60 $4.67 $4.54 $4.55 $4.56 $4.46 $4.31 $4.33 $4.29 $4.29 $4.18 $3.99 $4.01 $3.93 $3.99 $3.96 $3.92 $3.94 $3.98 $3.96 $3.99 $4.17 $4.17 $4.22 $4.20 $4.18 $4.19 $4.24 $4.30 $4.37 $4.24 $4.25 $4.26 $4.16 $4.01 $3.98 $3.94 $3.94 $3.83 $3.64 $3.66 $3.58 $3.64 $3.61 $3.57 $3.59 $3.63 $3.56 $3.59 44 45 46 47 48 49 50 51 52 53 54 55 56 57 The table shows 57 historical days of prices for wheat futures, corn futures, and sorghu Note: after calculating day-to-day price changes, you will have 56 observations for estir Wheat futures Corn futures Sorghum spot Historical price price price Day $/bushel $/bushel $/bushel 1 $5.00 $3.95 $3.60 2 $5.05 $3.92 $3.57 3 $5.18 $3.97 $3.62 4 $5.07 $3.93 $3.58 5 $4.85 $3.88 $3.53 6 $4.72 $3.82 $3.47 7 $4.70 $3.85 $3.50 8 $4.59 $3.83 $3.48 9 $4.74 $3.84 $3.49 10 $4.96 $3.91 $3.56 11 $4.89 $3.92 $3.57 12 $5.01 $3.96 $3.61 13 $4.95 $3.93 $3.58 14 $5.05 $3.99 $3.64 15 $5.08 $3.98 $3.63 16 $4.91 $3.90 $3.55 17 $4.83 $3.89 $3.54 18 $4.86 $3.85 $3.50 19 $4.69 $3.79 $3.44 20 $4.67 $3.85 $3.50 21 $4.66 $3.90 $3.55 22 $4.58 $3.88 $3.58 23 $4.63 $3.84 $3.54 24 $4.72 $3.89 $3.59 25 $4.90 $3.96 $3.66 26 $4.85 $3.96 $3.66 27 $4.95 $4.07 $3.77 28 $5.19 $4.17 $3.87 29 $5.32 $4.17 $3.87 30 31 32 33 34 35 36 37 38 39 40 41 42 43 $5.67 $5.50 $5.49 $5.50 $5.43 $5.82 $5.80 $5.74 $5.70 $5.64 $5.62 $5.56 $5.50 $5.30 $5.22 $5.18 $5.22 $5.13 $5.05 $5.11 $5.02 $4.99 $4.99 $4.96 $4.92 $4.97 $4.97 $5.02 $4.47 $4.47 $4.52 $4.50 $4.48 $4.49 $4.54 $4.60 $4.67 $4.54 $4.55 $4.56 $4.46 $4.31 $4.33 $4.29 $4.29 $4.18 $3.99 $4.01 $3.93 $3.99 $3.96 $3.92 $3.94 $3.98 $3.96 $3.99 $4.17 $4.17 $4.22 $4.20 $4.18 $4.19 $4.24 $4.30 $4.37 $4.24 $4.25 $4.26 $4.16 $4.01 $3.98 $3.94 $3.94 $3.83 $3.64 $3.66 $3.58 $3.64 $3.61 $3.57 $3.59 $3.63 $3.56 $3.59 44 45 46 47 48 49 50 51 52 53 54 55 56 57
Step by Step Solution
There are 3 Steps involved in it

Get step-by-step solutions from verified subject matter experts