

Question: at i m -2 6+ 5 3 2 + -2- -3 4 The plot above is created with the parametric equations (x(t) = a
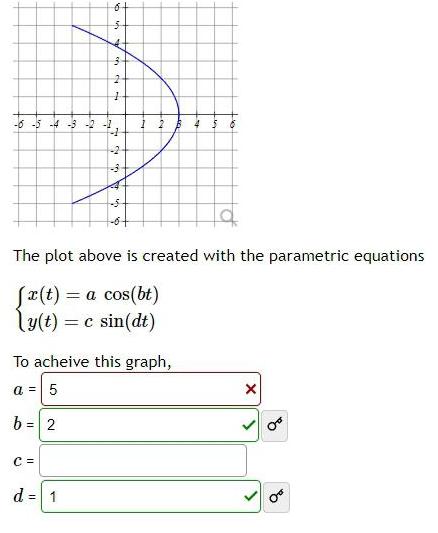
at i m -2 6+ 5 3 2 + -2- -3 4 The plot above is created with the parametric equations (x(t) = a cos(bt) y(t) = c sin(dt) To acheive this graph, a = 5 b= 2 C = d=1 x
Step by Step Solution
There are 3 Steps involved in it
1 Expert Approved Answer
Step: 1 Unlock

Question Has Been Solved by an Expert!
Get step-by-step solutions from verified subject matter experts
Step: 2 Unlock
Step: 3 Unlock