

Question: ata Management - Ap X be Maps M Gmail Dayforce ADP W S Ims/quizzing/user/attempt/quiz_start_frame_auto.d2l?ou=23454716&isprv=&drc=0&qi=8309854&cfql=0&dnb=0&fromQB=0& X U b) 1 Odo 2 Post Attendee - Zoom d)
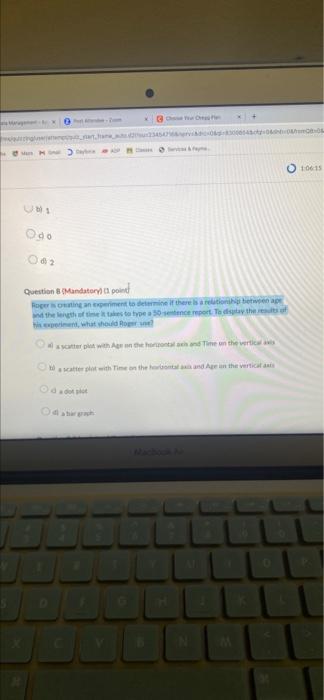
ata Management - Ap X be Maps M Gmail Dayforce ADP W S Ims/quizzing/user/attempt/quiz_start_frame_auto.d2l?ou=23454716&isprv=&drc=0&qi=8309854&cfql=0&dnb=0&fromQB=0& X U b) 1 Odo 2 Post Attendee - Zoom d) 2 E c) a dot plot Question 8 (Mandatory) (1 point) Roger is creating an experiment to determine if there is a relationship between age and the length of time it takes to type a 50-sentence report. To display the results of his experiment, what should Roger use? d) a bar graph X JU R a) a scatter plot with Age on the horizontal axis and Time on the vertical axis Ob) a scatter plot with Time on the horizontal axis and Age on the vertical axis Classes F C Choose Your Chegg Plan OV Services & Payme... B MacBook Air H X + N 8 DUI M K H 0 O 1:06:15
bi 1 c) 0 0. 2 Question 8 Mandatema point tia ceporinen, what would Boes ant? a sot pise 4) atier eran
Step by Step Solution
There are 3 Steps involved in it
1 Expert Approved Answer
Step: 1 Unlock

Question Has Been Solved by an Expert!
Get step-by-step solutions from verified subject matter experts
Step: 2 Unlock
Step: 3 Unlock