

Question: (a)The scatterplot resembles an exponential model, emulating a squared function with a downward curve. Squaring the y-values would linearize the data. (b)The scatterplot resembles a
(a)The scatterplot resembles an exponential model, emulating a squared function with a downward curve. Squaring the y-values would linearize the data.
(b)The scatterplot resembles a power model, emulating a square root function with a downward curve. Taking the square root of the y-values would linearize the data.
(c)The scatterplot resembles an exponential model, emulating a squared function with a downward curve. Exponentiating the y-values to a power of 10 would linearize the data.
(d)The scatterplot resembles a power model, emulating a square root function with a downward curve. Squaring the y-values would linearize the data.
(e)The scatterplot resembles a power model, emulating a squared function with a downward curve. Exponentiating the y-values to a power of 10 would linearize the data.
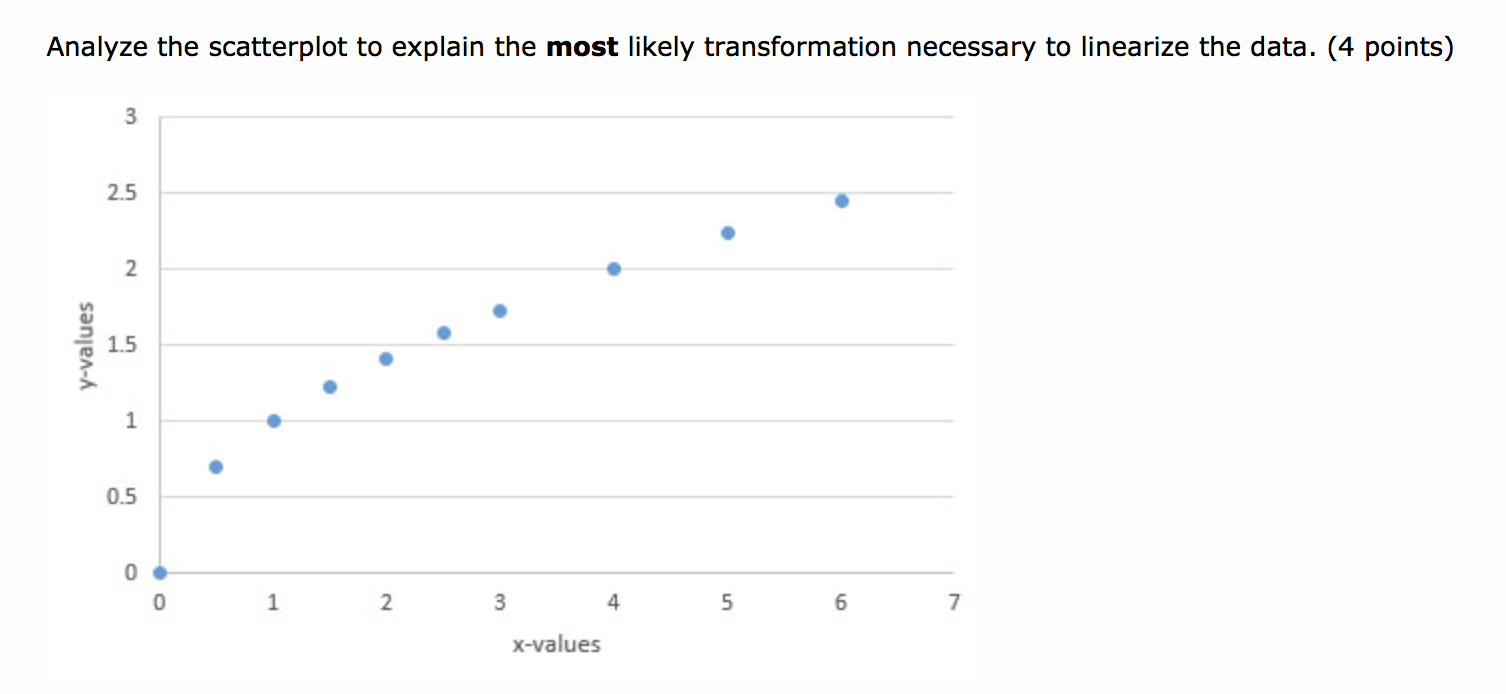
Analyze the scatterplot to explain the most likely transformation necessary to linearize the data. (4 points) 2.5 2 y-values 1.5 1 0.5 0 0 1 2 4 5 6 7 x-values
Step by Step Solution
There are 3 Steps involved in it

Get step-by-step solutions from verified subject matter experts