

Question: Atlantic Hospital System Creating Value in Supply Chain Optimization Overview The Atlantic Hospital System is a regional health service provider located in the central part
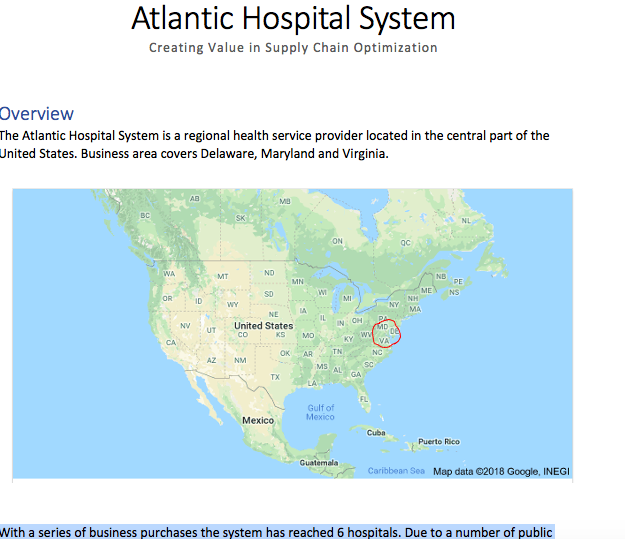
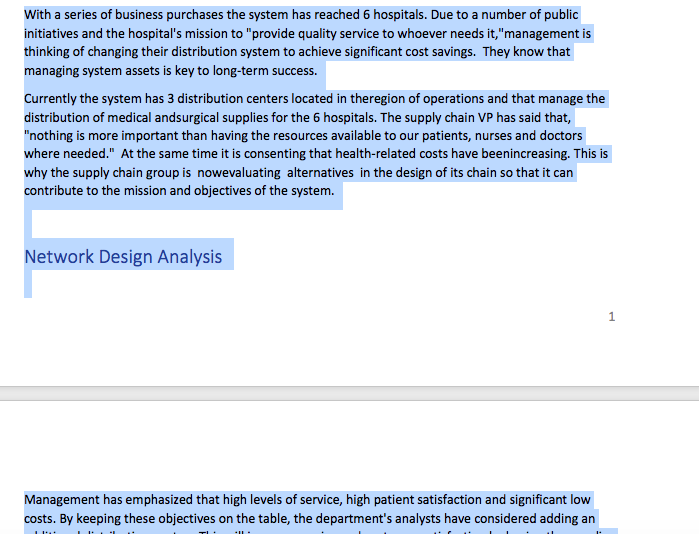
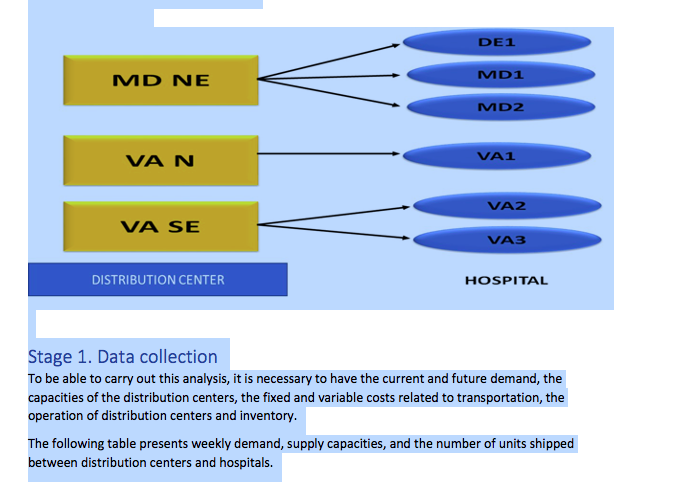
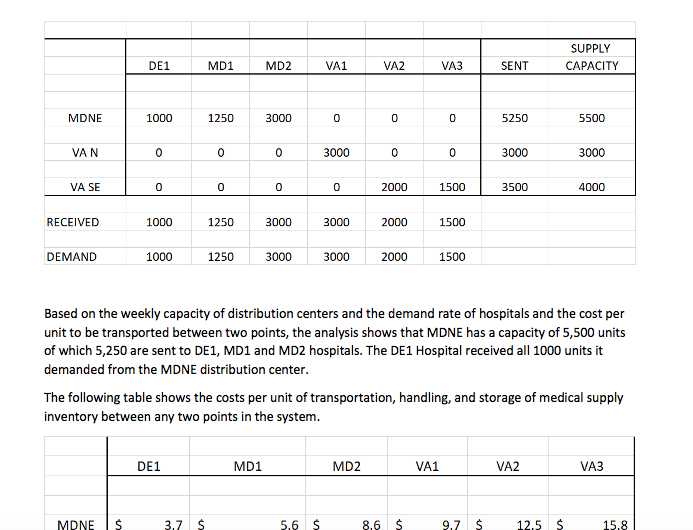
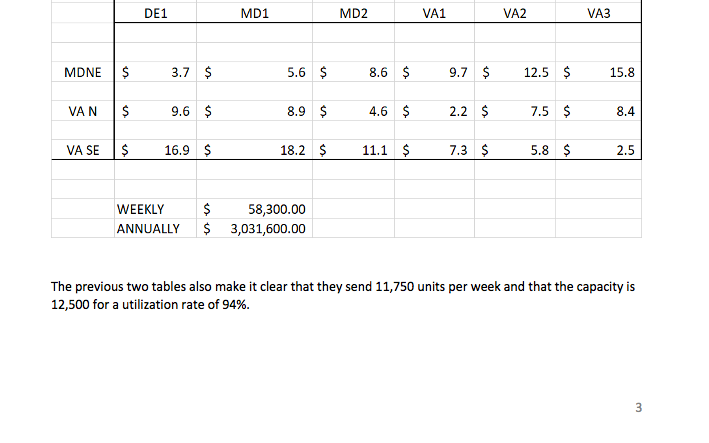
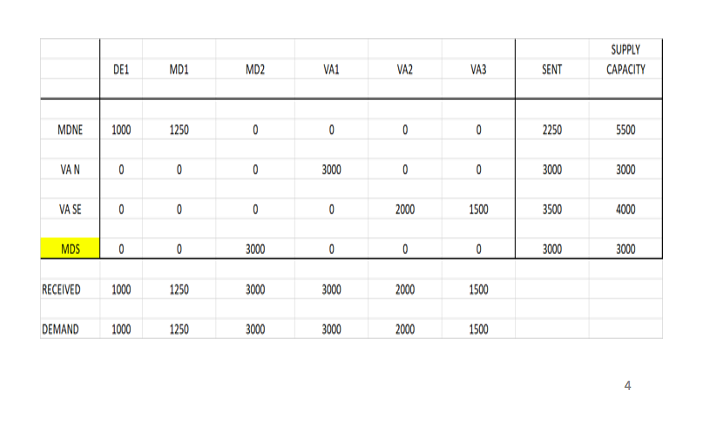
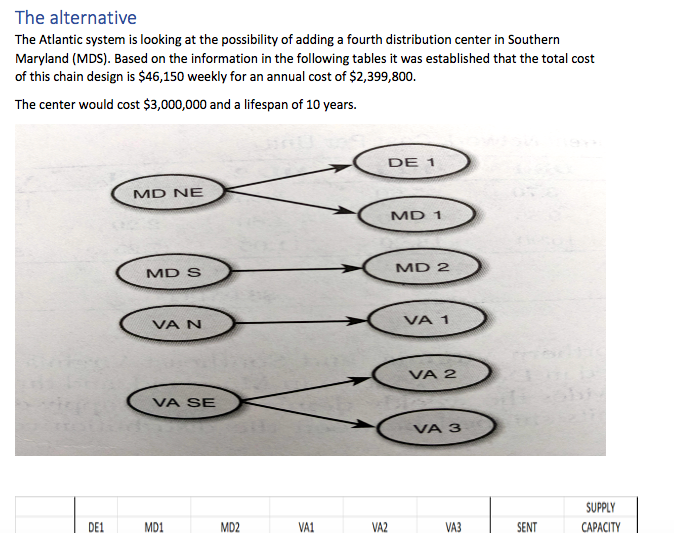
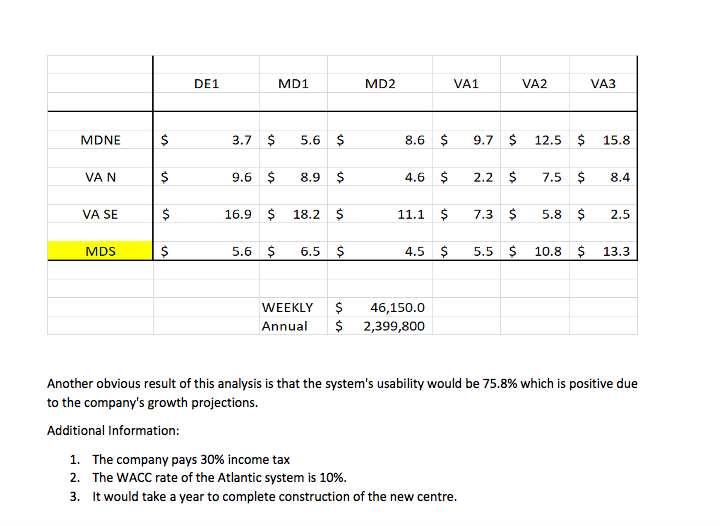
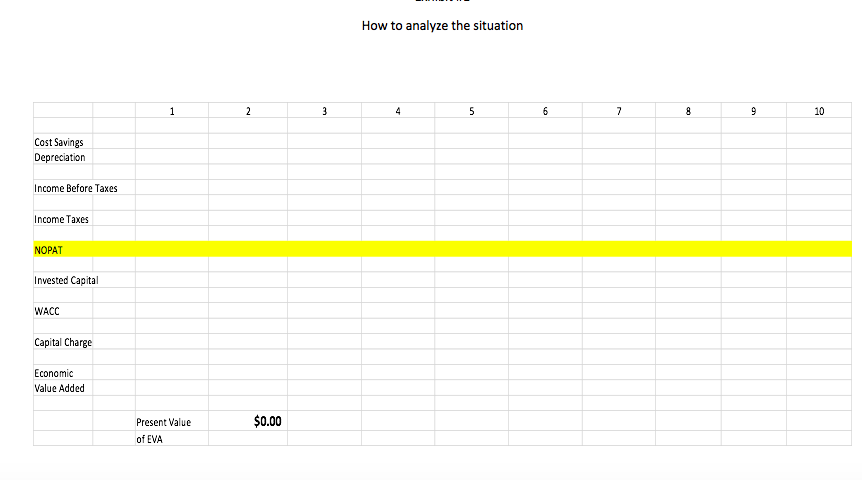
Atlantic Hospital System Creating Value in Supply Chain Optimization Overview The Atlantic Hospital System is a regional health service provider located in the central part of the United States. Business area covers Delaware, Maryland and Virginia. AB MB NL ON gc WA ND MT MN M NE PE ME NS NH MA OR ID MI NY LA SD WY NE United States CO KS IL NV UT INOM MD ww KY MO CA VA NC OK AR TN AZ NM MS AL sc GA TX LA Gulf of Mexico Mexico Cuba Puerto Rico Guatemala Caribbean Sea Map data 2018 Google, INEGI With a series of business purchases the system has reached 6 hospitals. Due to a number of public With a series of business purchases the system has reached 6 hospitals. Due to a number of public initiatives and the hospital's mission to "provide quality service to whoever needs it,"management is thinking of changing their distribution system to achieve significant cost savings. They know that managing system assets is key to long-term success. Currently the system has 3 distribution centers located in theregion of operations and that manage the distribution of medical andsurgical supplies for the 6 hospitals. The supply chain VP has said that, "nothing is more important than having the resources available to our patients, nurses and doctors where needed." At the same time it is consenting that health-related costs have beenincreasing. This is why the supply chain group is nowevaluating alternatives in the design of its chain so that it can contribute to the mission and objectives of the system. Network Design Analysis 1 Management has emphasized that high levels of service, high patient satisfaction and significant low costs. By keeping these objectives on the table, the department's analysts have considered adding an DE1 MD NE MD1 MD2 VAN VA1 VAZ VA SE VA3 DISTRIBUTION CENTER HOSPITAL Stage 1. Data collection To be able to carry out this analysis, it is necessary to have the current and future demand, the capacities of the distribution centers, the fixed and variable costs related to transportation, the operation of distribution centers and inventory. The following table presents weekly demand, supply capacities, and the number of units shipped between distribution centers and hospitals. SUPPLY CAPACITY DE1 MD1 MD2 VA1 VA2 VA3 SENT MDNE 1000 1250 3000 0 0 0 5250 5500 VAN 0 0 0 3000 0 0 3000 3000 VA SE 0 0 0 0 2000 1500 3500 4000 RECEIVED 1000 1250 3000 3000 2000 1500 DEMAND 1000 1250 3000 3000 2000 1500 Based on the weekly capacity of distribution centers and the demand rate of hospitals and the cost per unit to be transported between two points, the analysis shows that MDNE has a capacity of 5,500 units of which 5,250 are sent to DE1, MD1 and MD2 hospitals. The DE1 Hospital received all 1000 units it demanded from the MDNE distribution center. The following table shows the costs per unit of transportation, handling, and storage of medical supply inventory between any two points in the system. DE1 MD1 MD2 VA1 VA2 VA3 MDNE $ 3.7 $ 5.6 $ 8.6 $ 9.7 $ 12.5 $ 15.8 DE1 MD1 MD2 VA1 VA2 VA3 MDNE $ 3.7 $ 5.6 $ 8.6 $ 9.7 $ 12.5 $ 15.8 VAN $ 9.6 $ 8.9 $ 4.6 $ 2.2 $ 7.5 $ 8.4 VA SE $ 16.9 $ 18.2 $ 11.1 $ 7.3 $ 5.8 $ 2 2.5 WEEKLY ANNUALLY $ $ 58,300.00 3,031,600.00 The previous two tables also make it clear that they send 11,750 units per week and that the capacity is 12,500 for a utilization rate of 94%. 3 SUPPLY CAPACITY DE1 MD1 MD2 VA1 VA2 VA3 SENT MDNE 1000 1250 0 0 0 0 2250 5500 VAN 0 0 0 3000 0 0 3000 3000 VASE 0 0 0 0 2000 1500 3500 4000 MDS 0 0 3000 0 0 0 3000 3000 RECEIVED 1000 1250 3000 3000 2000 1500 DEMAND 1000 1250 3000 3000 2000 1500 The alternative The Atlantic system is looking at the possibility of adding a fourth distribution center in Southern Maryland (MDS). Based on the information in the following tables it was established that the total cost of this chain design is $46,150 weekly for an annual cost of $2,399,800. The center would cost $3,000,000 and a lifespan of 10 years. DE 1 MD NE MD MD S MD 2 VAN VA 1 VA 2 VA SE VA 3 SUPPLY CAPACITY DE1 MD1 MD2 VA1 VA2 VA3 SENT How to analyze the situation 1 2 3 4 5 6 7 8 9 10 Cost Savings Depreciation Income Before Taxes Income Taxes NOPAT Invested Capital WACC Capital Charge Economic Value Added $0.00 Present Value of EVA Atlantic Hospital System Creating Value in Supply Chain Optimization Overview The Atlantic Hospital System is a regional health service provider located in the central part of the United States. Business area covers Delaware, Maryland and Virginia. AB MB NL ON gc WA ND MT MN M NE PE ME NS NH MA OR ID MI NY LA SD WY NE United States CO KS IL NV UT INOM MD ww KY MO CA VA NC OK AR TN AZ NM MS AL sc GA TX LA Gulf of Mexico Mexico Cuba Puerto Rico Guatemala Caribbean Sea Map data 2018 Google, INEGI With a series of business purchases the system has reached 6 hospitals. Due to a number of public With a series of business purchases the system has reached 6 hospitals. Due to a number of public initiatives and the hospital's mission to "provide quality service to whoever needs it,"management is thinking of changing their distribution system to achieve significant cost savings. They know that managing system assets is key to long-term success. Currently the system has 3 distribution centers located in theregion of operations and that manage the distribution of medical andsurgical supplies for the 6 hospitals. The supply chain VP has said that, "nothing is more important than having the resources available to our patients, nurses and doctors where needed." At the same time it is consenting that health-related costs have beenincreasing. This is why the supply chain group is nowevaluating alternatives in the design of its chain so that it can contribute to the mission and objectives of the system. Network Design Analysis 1 Management has emphasized that high levels of service, high patient satisfaction and significant low costs. By keeping these objectives on the table, the department's analysts have considered adding an DE1 MD NE MD1 MD2 VAN VA1 VAZ VA SE VA3 DISTRIBUTION CENTER HOSPITAL Stage 1. Data collection To be able to carry out this analysis, it is necessary to have the current and future demand, the capacities of the distribution centers, the fixed and variable costs related to transportation, the operation of distribution centers and inventory. The following table presents weekly demand, supply capacities, and the number of units shipped between distribution centers and hospitals. SUPPLY CAPACITY DE1 MD1 MD2 VA1 VA2 VA3 SENT MDNE 1000 1250 3000 0 0 0 5250 5500 VAN 0 0 0 3000 0 0 3000 3000 VA SE 0 0 0 0 2000 1500 3500 4000 RECEIVED 1000 1250 3000 3000 2000 1500 DEMAND 1000 1250 3000 3000 2000 1500 Based on the weekly capacity of distribution centers and the demand rate of hospitals and the cost per unit to be transported between two points, the analysis shows that MDNE has a capacity of 5,500 units of which 5,250 are sent to DE1, MD1 and MD2 hospitals. The DE1 Hospital received all 1000 units it demanded from the MDNE distribution center. The following table shows the costs per unit of transportation, handling, and storage of medical supply inventory between any two points in the system. DE1 MD1 MD2 VA1 VA2 VA3 MDNE $ 3.7 $ 5.6 $ 8.6 $ 9.7 $ 12.5 $ 15.8 DE1 MD1 MD2 VA1 VA2 VA3 MDNE $ 3.7 $ 5.6 $ 8.6 $ 9.7 $ 12.5 $ 15.8 VAN $ 9.6 $ 8.9 $ 4.6 $ 2.2 $ 7.5 $ 8.4 VA SE $ 16.9 $ 18.2 $ 11.1 $ 7.3 $ 5.8 $ 2 2.5 WEEKLY ANNUALLY $ $ 58,300.00 3,031,600.00 The previous two tables also make it clear that they send 11,750 units per week and that the capacity is 12,500 for a utilization rate of 94%. 3 SUPPLY CAPACITY DE1 MD1 MD2 VA1 VA2 VA3 SENT MDNE 1000 1250 0 0 0 0 2250 5500 VAN 0 0 0 3000 0 0 3000 3000 VASE 0 0 0 0 2000 1500 3500 4000 MDS 0 0 3000 0 0 0 3000 3000 RECEIVED 1000 1250 3000 3000 2000 1500 DEMAND 1000 1250 3000 3000 2000 1500 The alternative The Atlantic system is looking at the possibility of adding a fourth distribution center in Southern Maryland (MDS). Based on the information in the following tables it was established that the total cost of this chain design is $46,150 weekly for an annual cost of $2,399,800. The center would cost $3,000,000 and a lifespan of 10 years. DE 1 MD NE MD MD S MD 2 VAN VA 1 VA 2 VA SE VA 3 SUPPLY CAPACITY DE1 MD1 MD2 VA1 VA2 VA3 SENT How to analyze the situation 1 2 3 4 5 6 7 8 9 10 Cost Savings Depreciation Income Before Taxes Income Taxes NOPAT Invested Capital WACC Capital Charge Economic Value Added $0.00 Present Value of EVA
Step by Step Solution
There are 3 Steps involved in it

Get step-by-step solutions from verified subject matter experts