

Question: Attach a spreadsheet showing calculation and a Word document showing your work and how you arrived at RBS's funding needs. Refer again to the case,
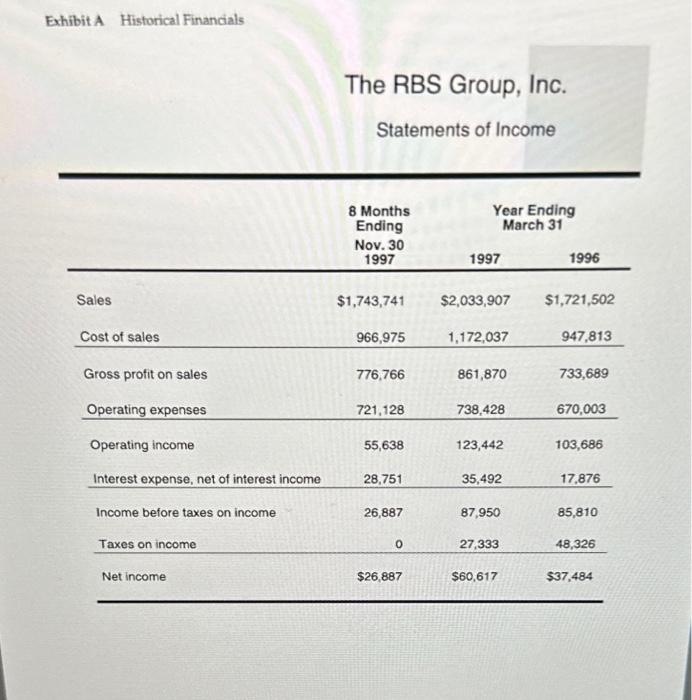
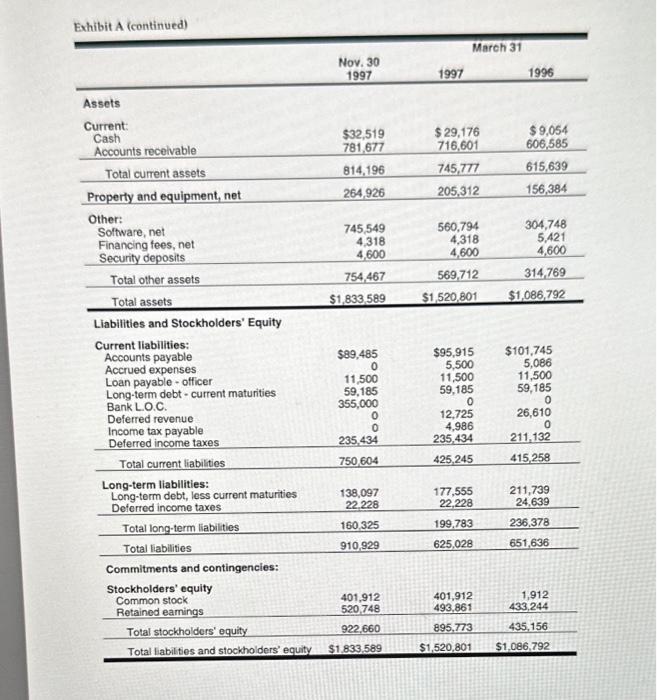
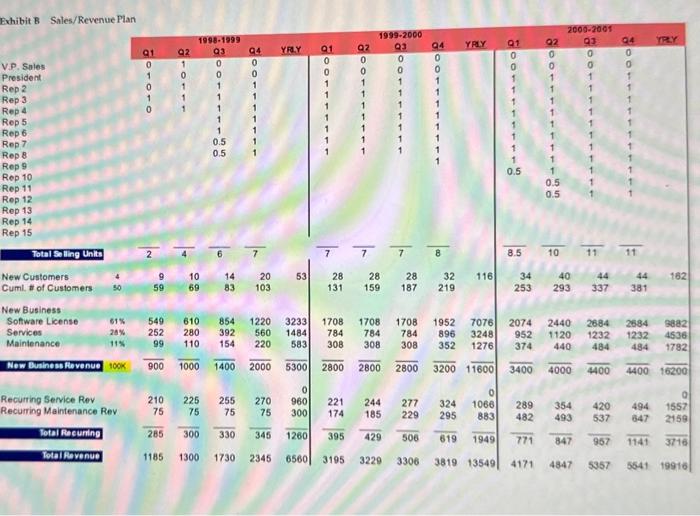
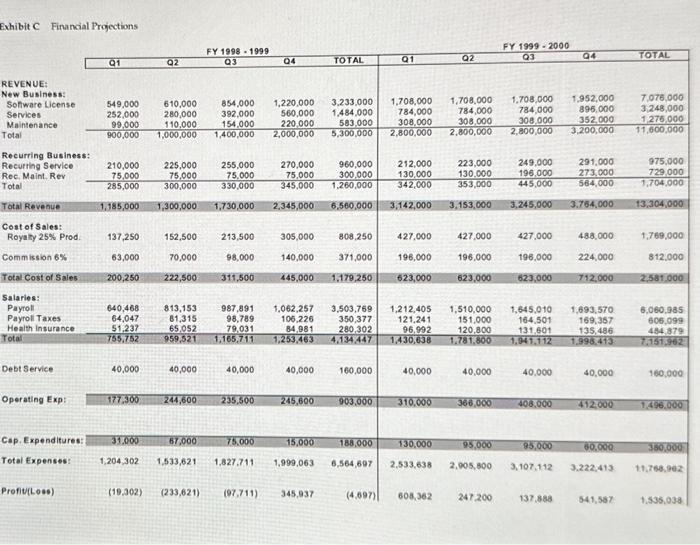
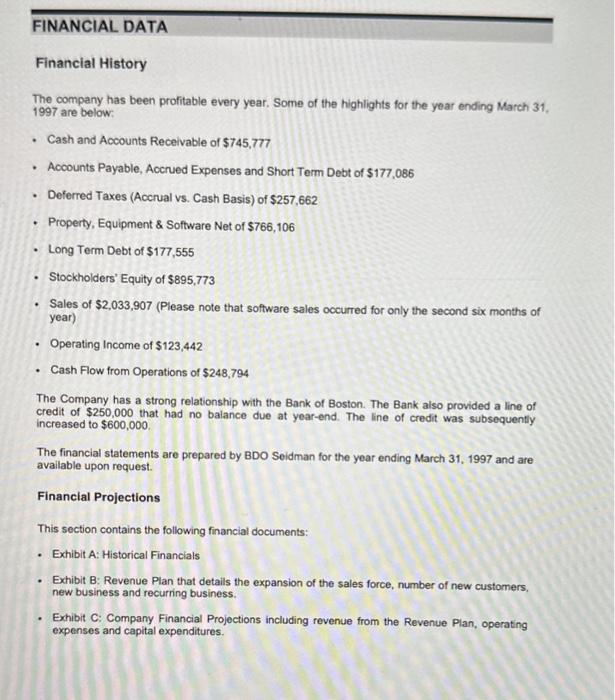
The RBS Group, Inc. Statements of Income Exhibit A (continued) Liabilities and Stockholders' Equity Current liabilities: Accounts payable Accrued expenses Loan payable - officer Long-term debt - current maturities Bank L.O.C. Deferred revenue Income tax payable Deferred income taxes Total current liabilities Long-term liabilities: Long-term debt, less current maturities Deferred income taxes Total long-term liabilities Total liablities \begin{tabular}{rrr} $89,485 & $95,915 & $101,745 \\ 0 & 5,500 & 5,086 \\ 11,500 & 11,500 & 11,500 \\ 59,185 & 59,185 & 59,185 \\ 355,000 & 0 & 0 \\ 0 & 12,725 & 26,610 \\ 0 & 4,986 & 0 \\ 235,434 & 235,434 & 211,132 \\ \hline 750,604 & 425,245 & 415,258 \\ \hline 138,097 & & \\ 22,228 & 177,555 & 211,739 \\ 160,325 & 22,228 & 24,639 \\ \hline 910,929 & 199,783 & 236,378 \\ \hline & 625,028 & 651,636 \\ \hline \end{tabular} Commitments and contingencies: Stockholders' equity Common stock Retained eamings \begin{tabular}{llr} 401,912 & 401,912 & 1,912 \\ 520,748 & 493,861 & 433,244 \\ 992,660 & 895,773 & 435,156 \\ \hline \end{tabular} Total liabilites and stockholders' equity $1.833.589 $1,520,801$1,086,792 Exhibit B Sales/Revenue Plan V.P. Snles President Rep 2 Rep 3 . Rep 4 Rep 5 Rep 7 Rep 8 Rep 9 Rep 10 Rep 11 Rep 12 Rep 13 Rep 14 Rep 15 Exhibit C Financial Projections REVENUE: New Business: Recurring Busines: Recurting Service Total Cost of Sales: \begin{tabular}{rrrrrrrrr|r|r} \hline Royaty 25\% Prod. & 137,250 & 152,500 & 213,500 & 305,000 & 308,250 & 427,000 & 427,000 & 427,000 & 488,000 & 1,769,000 \\ \hline Commission 6% & 63,000 & 70,000 & 98,000 & 140,000 & 371,000 & 196,000 & 196,000 & 196,000 & 224,000 & 812,000 \\ \hline Total Cost of 5 ales & 200,250 & 222,500 & 311,500 & 445,000 & 1,179,250 & 623,000 & 623,000 & 623,000 & 712,000 & 2,581,000 \end{tabular} Salaries: Debt Service 40,00040,00040,00040,000160,00040,00040,00040,000 Operating Exp: Financial History The company has been profitable every year. Some of the highlights for the year ending March 31 , 1997 are below: - Cash and Accounts Receivable of $745,777 - Accounts Payable, Accrued Expenses and Short Term Debt of $177,086 - Deferred Taxes (Accrual vs. Cash Basis) of $257,662 - Property, Equipment \& Software Net of $766,106 - Long Term Debt of $177,555 - Stockholders' Equity of $895,773 - Sales of $2,033,907 (Please note that software sales occurred for only the second six months of year) - Operating income of $123,442 - Cash flow from Operations of $248,794 The Company has a strong relationship with the Bank of Boston. The Bank also provided a line of credit of $250,000 that had no balance due at year-end. The line of credit was subsequently increased to $600,000. The financial statements are prepared by BDO Seidman for the year ending March 31, 1997 and are available upon request. Financial Projections This section contains the following financial documents: - Exhibit A: Historical Financials - Exhibit B: Revenue Plan that details the expansion of the sales force, number of new customers, new business and recurring business. - Exhibit C: Company Financial Projections including revenue from the Revenue Plan, operating expenses and capital expenditures. The RBS Group, Inc. Statements of Income Exhibit A (continued) Liabilities and Stockholders' Equity Current liabilities: Accounts payable Accrued expenses Loan payable - officer Long-term debt - current maturities Bank L.O.C. Deferred revenue Income tax payable Deferred income taxes Total current liabilities Long-term liabilities: Long-term debt, less current maturities Deferred income taxes Total long-term liabilities Total liablities \begin{tabular}{rrr} $89,485 & $95,915 & $101,745 \\ 0 & 5,500 & 5,086 \\ 11,500 & 11,500 & 11,500 \\ 59,185 & 59,185 & 59,185 \\ 355,000 & 0 & 0 \\ 0 & 12,725 & 26,610 \\ 0 & 4,986 & 0 \\ 235,434 & 235,434 & 211,132 \\ \hline 750,604 & 425,245 & 415,258 \\ \hline 138,097 & & \\ 22,228 & 177,555 & 211,739 \\ 160,325 & 22,228 & 24,639 \\ \hline 910,929 & 199,783 & 236,378 \\ \hline & 625,028 & 651,636 \\ \hline \end{tabular} Commitments and contingencies: Stockholders' equity Common stock Retained eamings \begin{tabular}{llr} 401,912 & 401,912 & 1,912 \\ 520,748 & 493,861 & 433,244 \\ 992,660 & 895,773 & 435,156 \\ \hline \end{tabular} Total liabilites and stockholders' equity $1.833.589 $1,520,801$1,086,792 Exhibit B Sales/Revenue Plan V.P. Snles President Rep 2 Rep 3 . Rep 4 Rep 5 Rep 7 Rep 8 Rep 9 Rep 10 Rep 11 Rep 12 Rep 13 Rep 14 Rep 15 Exhibit C Financial Projections REVENUE: New Business: Recurring Busines: Recurting Service Total Cost of Sales: \begin{tabular}{rrrrrrrrr|r|r} \hline Royaty 25\% Prod. & 137,250 & 152,500 & 213,500 & 305,000 & 308,250 & 427,000 & 427,000 & 427,000 & 488,000 & 1,769,000 \\ \hline Commission 6% & 63,000 & 70,000 & 98,000 & 140,000 & 371,000 & 196,000 & 196,000 & 196,000 & 224,000 & 812,000 \\ \hline Total Cost of 5 ales & 200,250 & 222,500 & 311,500 & 445,000 & 1,179,250 & 623,000 & 623,000 & 623,000 & 712,000 & 2,581,000 \end{tabular} Salaries: Debt Service 40,00040,00040,00040,000160,00040,00040,00040,000 Operating Exp: Financial History The company has been profitable every year. Some of the highlights for the year ending March 31 , 1997 are below: - Cash and Accounts Receivable of $745,777 - Accounts Payable, Accrued Expenses and Short Term Debt of $177,086 - Deferred Taxes (Accrual vs. Cash Basis) of $257,662 - Property, Equipment \& Software Net of $766,106 - Long Term Debt of $177,555 - Stockholders' Equity of $895,773 - Sales of $2,033,907 (Please note that software sales occurred for only the second six months of year) - Operating income of $123,442 - Cash flow from Operations of $248,794 The Company has a strong relationship with the Bank of Boston. The Bank also provided a line of credit of $250,000 that had no balance due at year-end. The line of credit was subsequently increased to $600,000. The financial statements are prepared by BDO Seidman for the year ending March 31, 1997 and are available upon request. Financial Projections This section contains the following financial documents: - Exhibit A: Historical Financials - Exhibit B: Revenue Plan that details the expansion of the sales force, number of new customers, new business and recurring business. - Exhibit C: Company Financial Projections including revenue from the Revenue Plan, operating expenses and capital expenditures
Step by Step Solution
There are 3 Steps involved in it

Get step-by-step solutions from verified subject matter experts